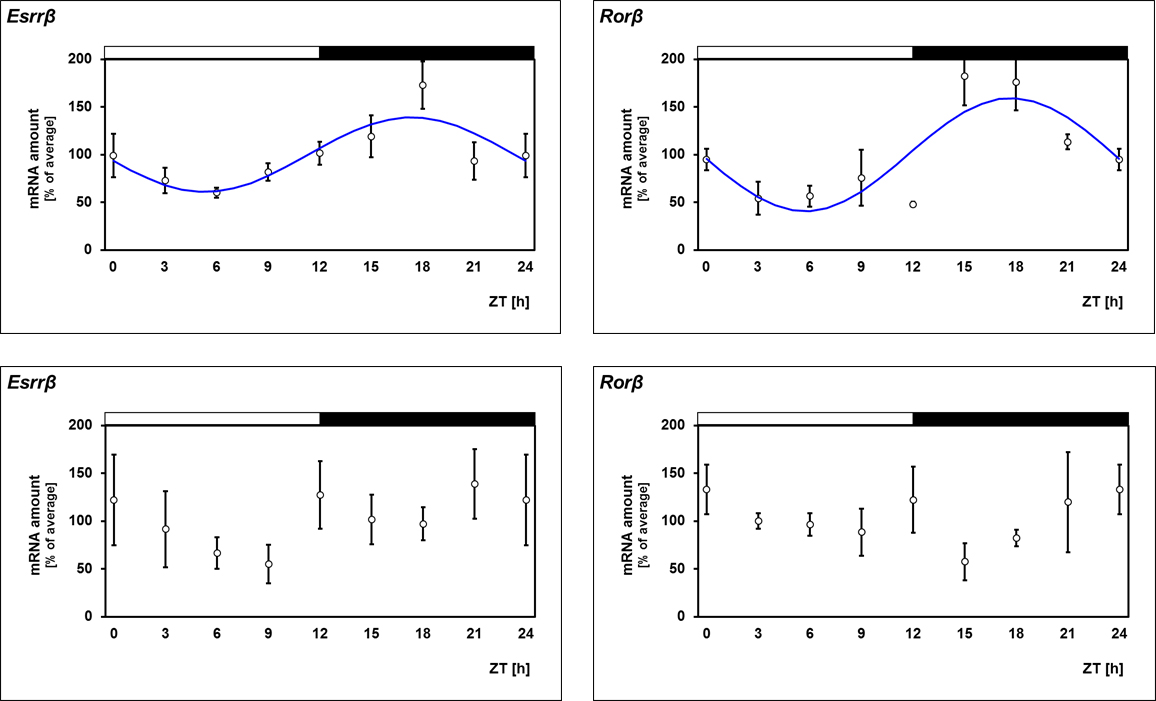
Figure 4. Comparative 24-h profiling of
Esrrβ and the reference gene
Rorβ in preparations of photoreceptor cells (upper line) and inner retinal neurons (lower line) of rats. The mRNA levels are determined
by using quantitative PCR (qPCR), and both are plotted as a function of Zeitgeber time (ZT). The blue lines represent the
periodic sinusoidal functions determined with cosinor analysis (only for p<0.05). The solid bars indicate the dark period.
Data represent a percentage of the average transcript amount during the 24-h period. The value of ZT0 was plotted twice at
ZT0 and ZT24. Each value represents mean ± standard error of the mean (SEM; n=4). Statistical analysis of transcriptional
profiling is provided in
Table 5. Note that daily variations of
Esrrβ are evoked by photoreceptor cells.
 Figure 4 of
Kunst, Mol Vis 2015; 21:173-184.
Figure 4 of
Kunst, Mol Vis 2015; 21:173-184.