Figure 3. Western blot analysis of Esrrβ conducted at different ZTs (Zeitgeber times) during the 24-h cycle in the whole rat retina.
The upper lanes show a representative western blot with Esrrβ immunostaining at about 52 kDa. The lower lanes show the β-actin
signal to which the Esrrβ immunostaining was normalized. The diagram shows the quantification of immunoreactivity in relation
to the corresponding β-actin signal. The solid bar indicates the dark period in the 12 h:12 h light-dark cycles. Data were
obtained with densitometric measurement and represent percentages of the overall maximal value. Each value is the mean ± standard
error of the mean (SEM; n=4). Note that Esrrβ immunoreactivity is elevated during the light phase (p=0.041 in one-way ANOVA).
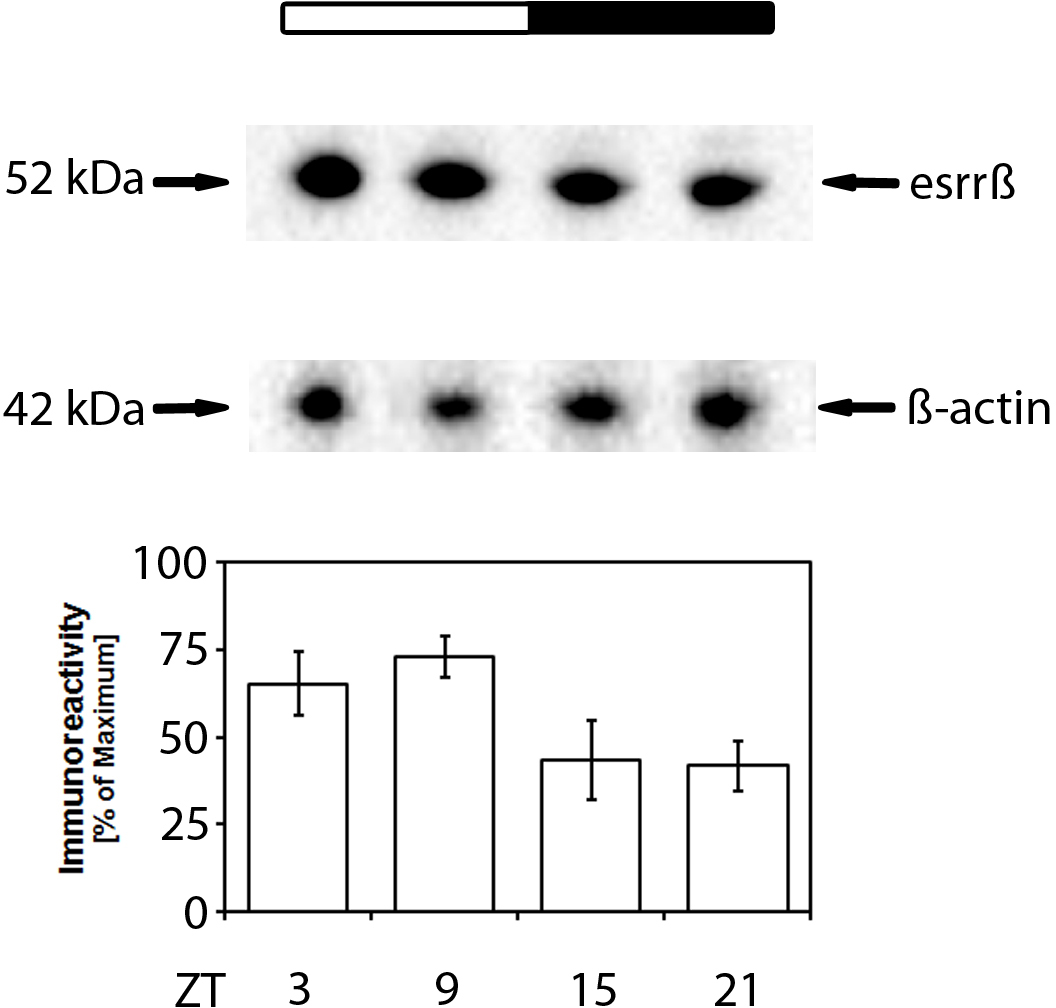
 Figure 3 of
Kunst, Mol Vis 2015; 21:173-184.
Figure 3 of
Kunst, Mol Vis 2015; 21:173-184.