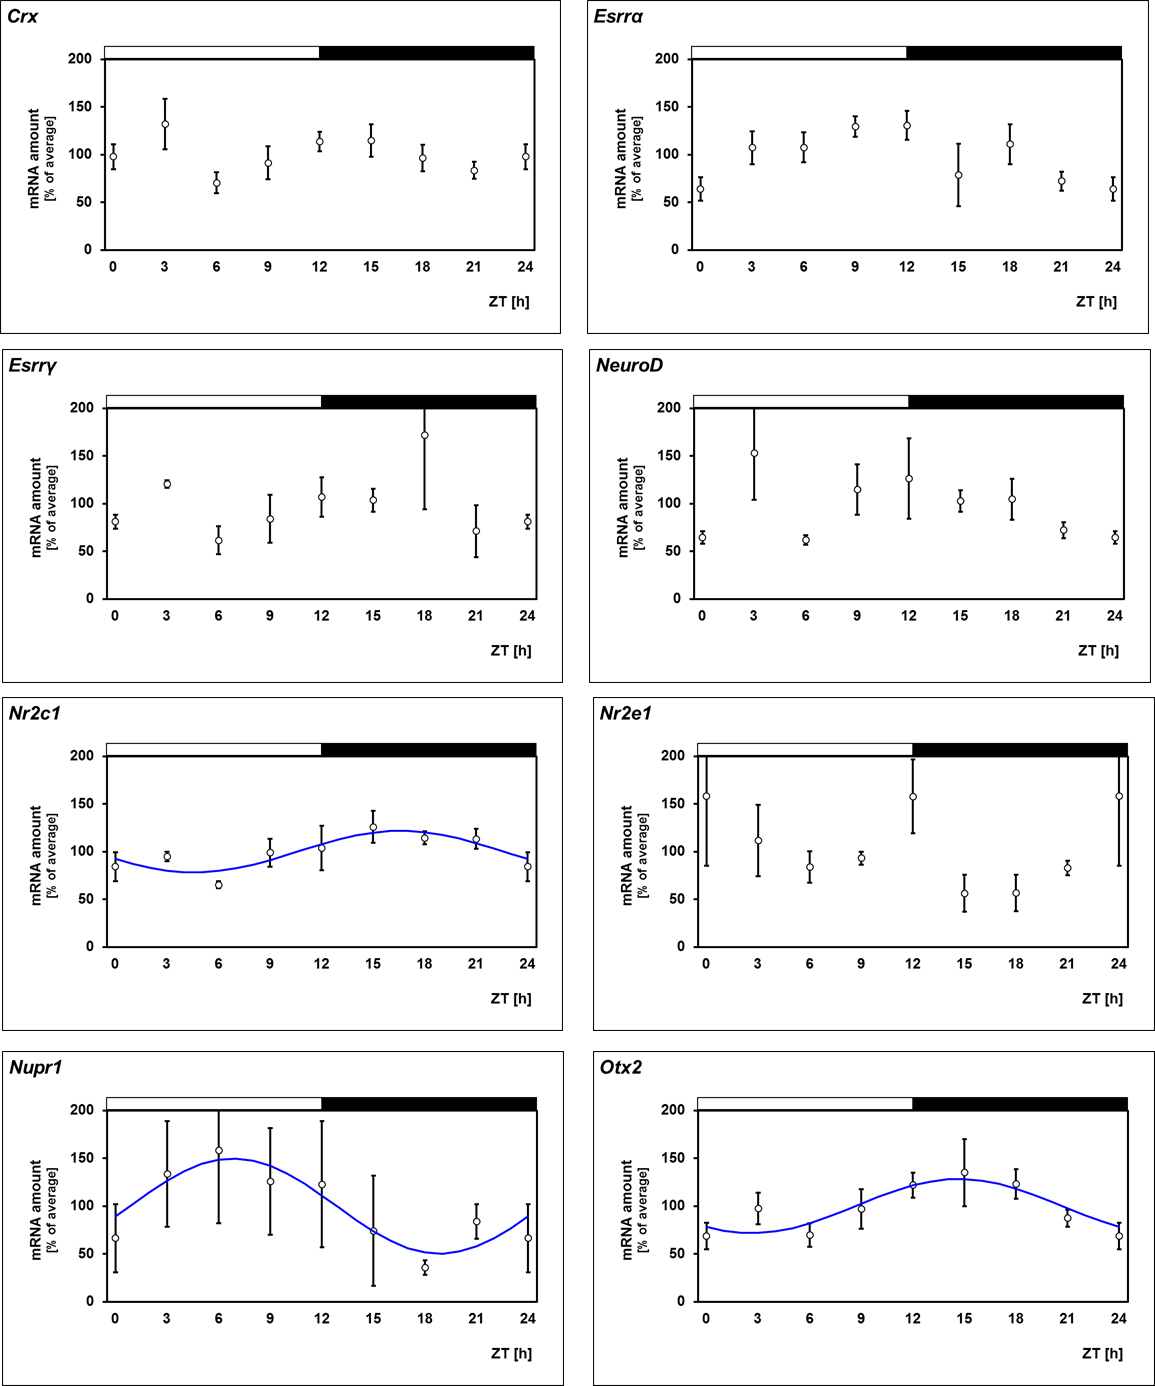
Figure 1. Twenty-four-hour profiling of various nuclear orphan receptors in preparations of the whole rat retina under 12 h:12 h light-dark
cycles. The mRNA levels are plotted as a function of Zeitgeber time (ZT). The blue lines represent the periodic sinusoidal
functions (illustrated only for p<0.05 in cosinor analysis). The solid bars indicate the dark period. Data represent a percentage
of the average transcript amount during the 24-h period. The value of ZT0 was plotted twice at ZT0 and ZT24. Each value represents
mean ± standard error of the mean (SEM; n=4). Statistical analysis of transcriptional profiling is provided in
Table 2.
 Figure 1 of
Kunst, Mol Vis 2015; 21:173-184.
Figure 1 of
Kunst, Mol Vis 2015; 21:173-184.