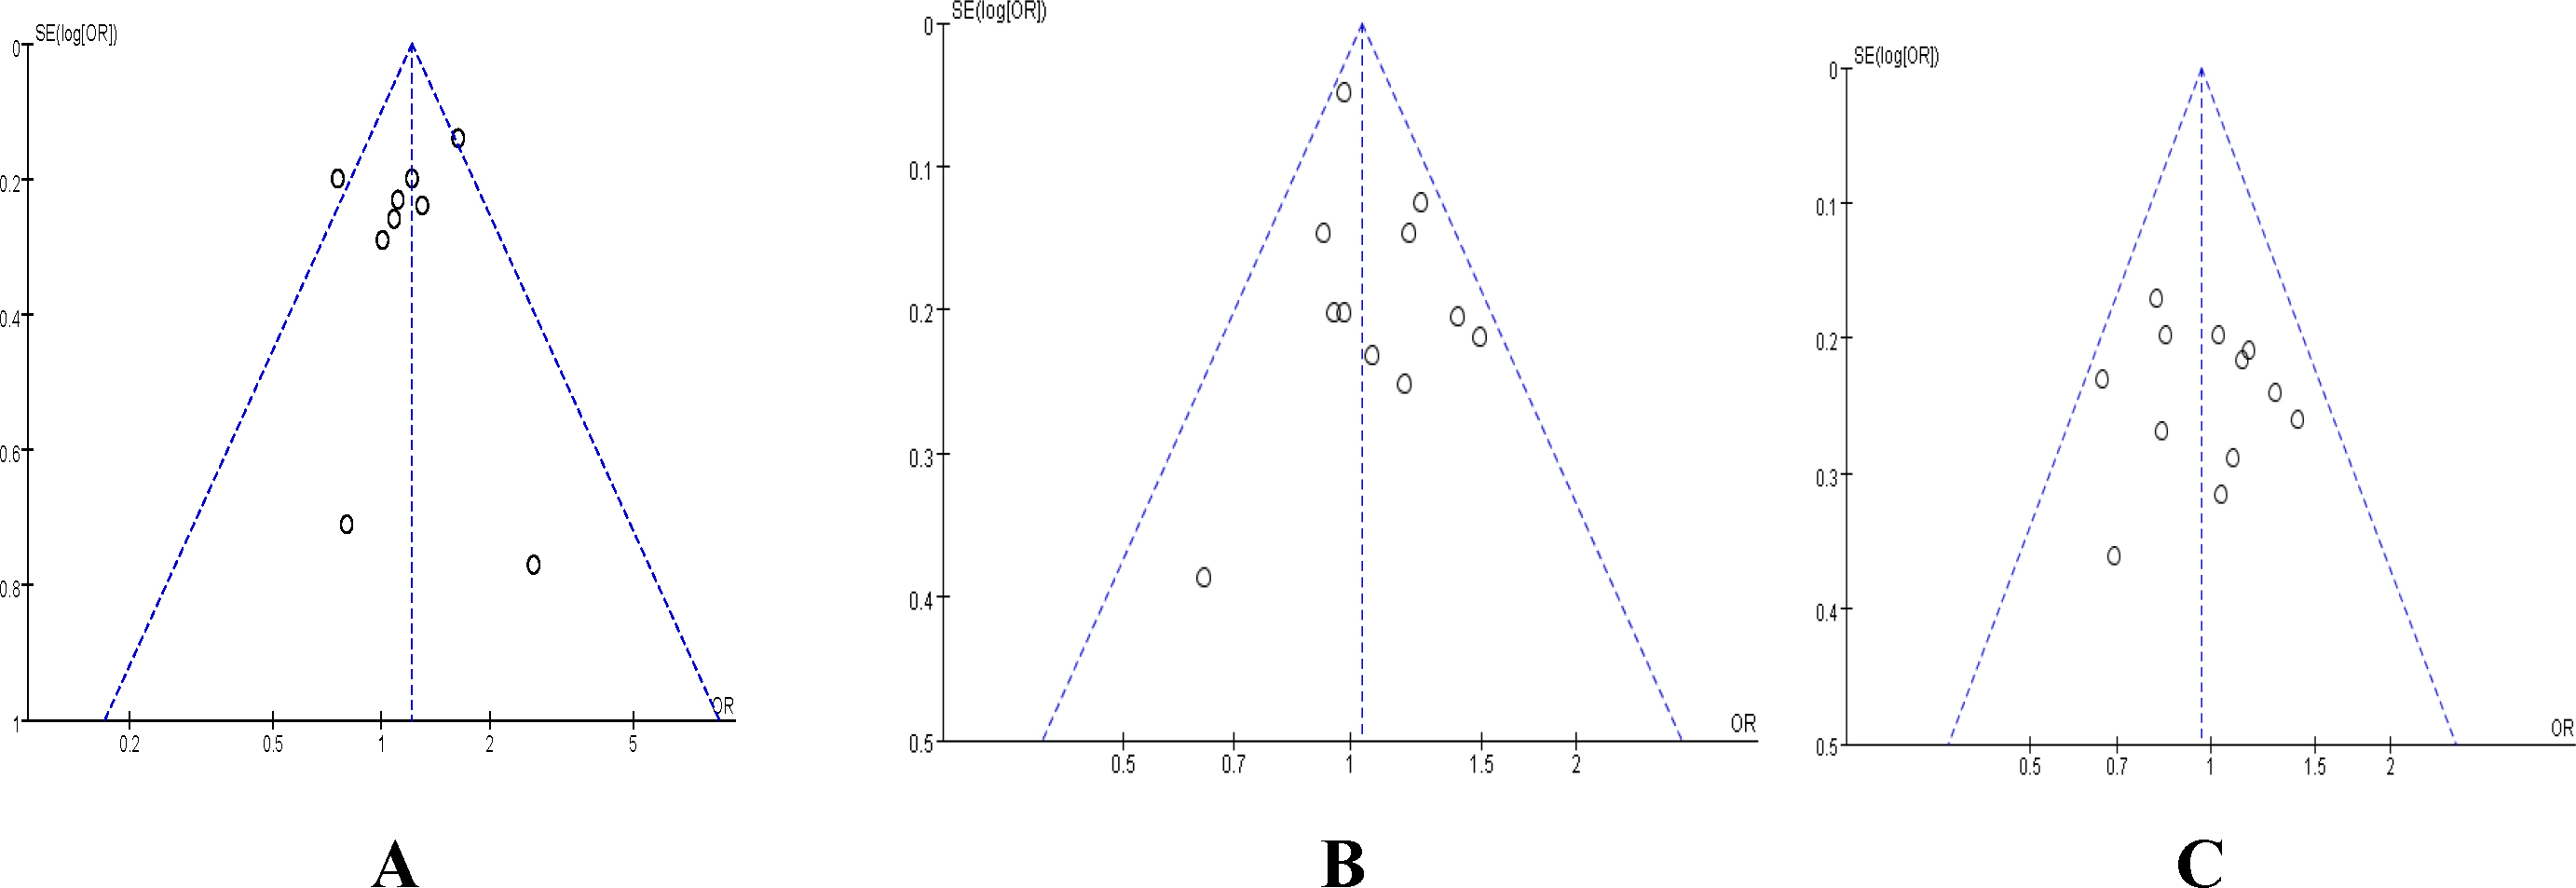
Figure 8. Begg’s funnel plot to test for a publication bias. Each circle denotes an independent study for the indicated association.
Log [OR], natural logarithm of OR. Horizontal line stands for mean effect size. A:
rs2165241; B:
rs1048661; C:
rs3825942.
 Figure 8 of
Wu, Mol Vis 2015; 21:165-172.
Figure 8 of
Wu, Mol Vis 2015; 21:165-172.