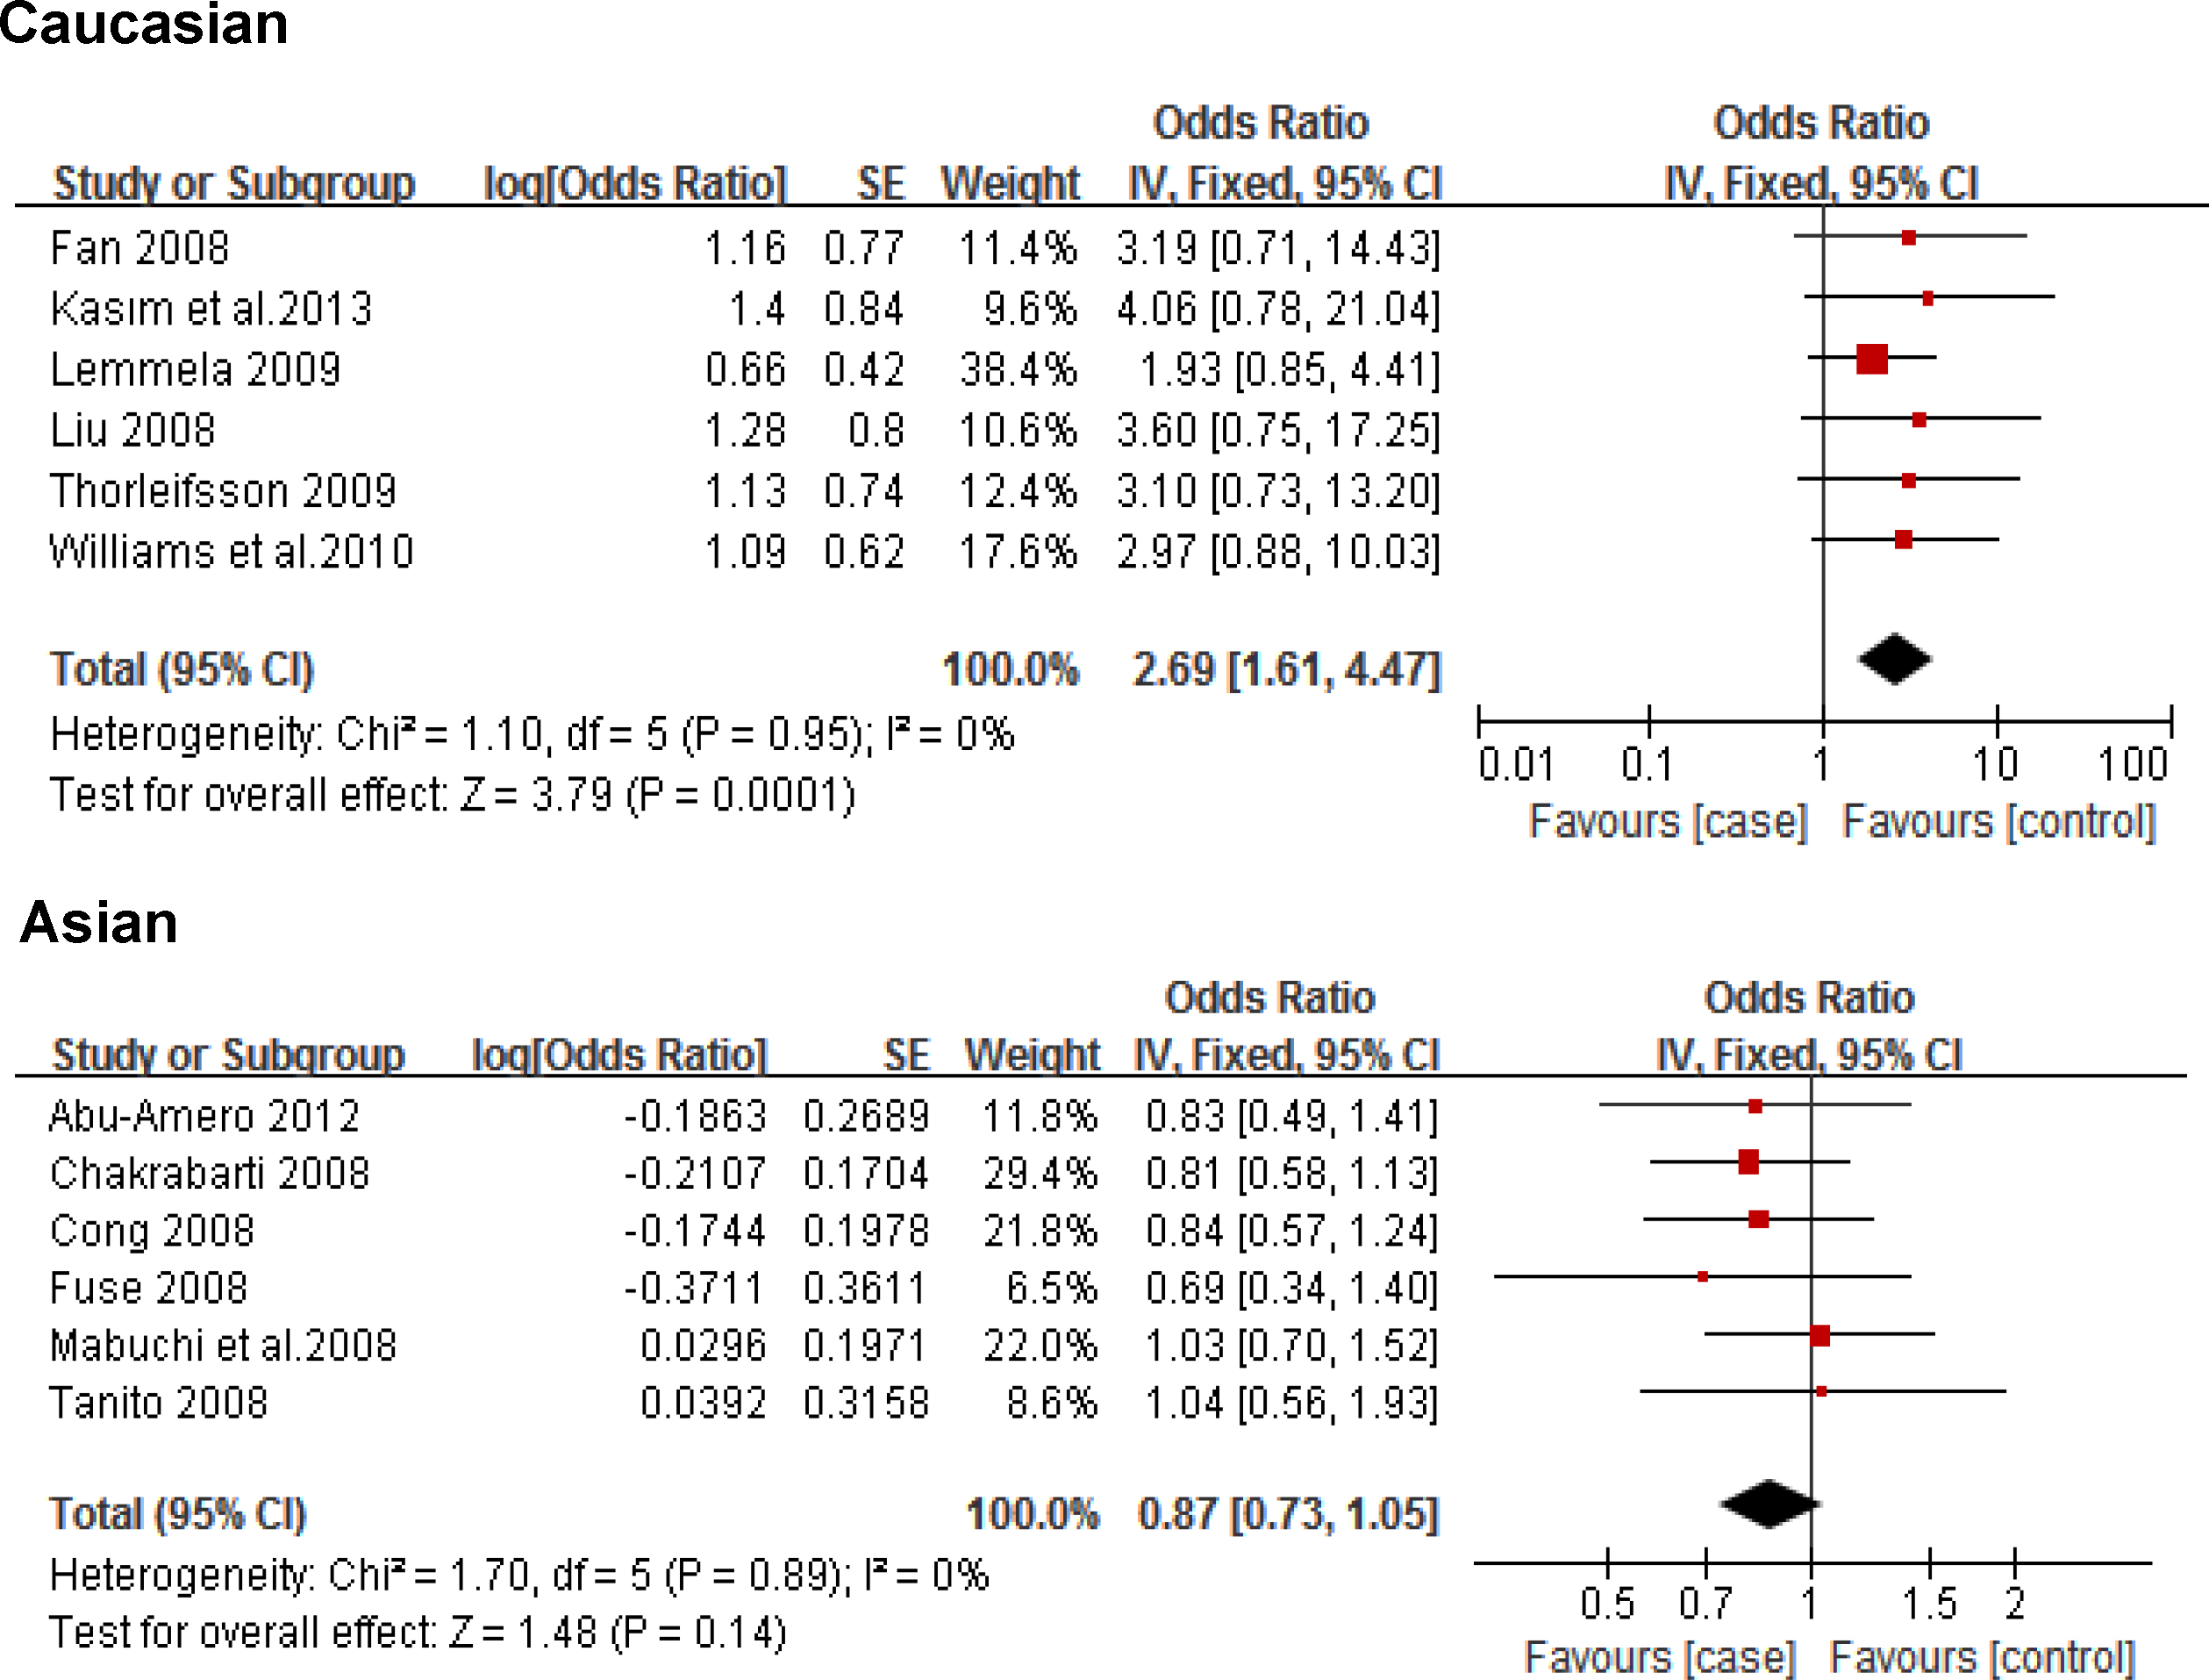
Figure 7. Forest plot of the association of POAG with
rs3825942 in the Caucasian and Asian populations; the horizontal lines correspond to the study-specific OR and 95% CI, respectively.
The area of the squares reflects the study-specific weight. The diamond represents the pooled results of the OR and 95%CI.
In this analysis, a fixed-effects model was used.
 Figure 7 of
Wu, Mol Vis 2015; 21:165-172.
Figure 7 of
Wu, Mol Vis 2015; 21:165-172.