Figure 7. In the RPE-choroid complex of FDM eyes, the levels of the TGF-βs mRNA expression were analyzed by real-time PCR normalized
to the β-actin expression. The TGF-β 1, 2, and 3 mRNA levels were all significantly increased in the RPE-choroid complex of
FDM eyes in comparison to control eyes. Data are expressed as the fold change over the control sample, as determined by the
delta-delta Ct method. Bars, SD * represents statistically significant (Student’s paired t test).
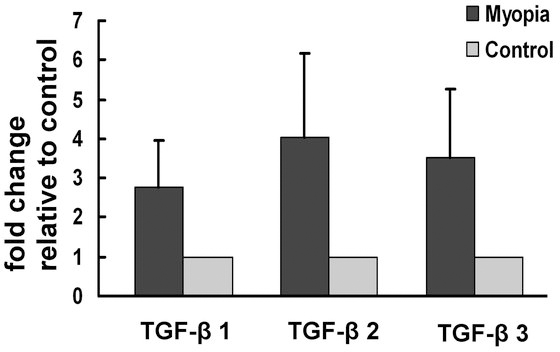
 Figure 7 of
Wu, Mol Vis 2015; 21:138-147.
Figure 7 of
Wu, Mol Vis 2015; 21:138-147.