Figure 5. Western blot analysis of Col2 and α-SMA (bands at about 142 kDa and 42 kDa, respectively) in the scleras of mice with form-deprivation
myopia (FDM). A: After 21 days of visual deprivation, both the Col2 and α-SMA expression levels were increased. B: A densitometry analysis showed that the Col2 and α-SMA expressions were significantly increased in FDM eyes compared to
the control eyes (p<0.05, respectively).
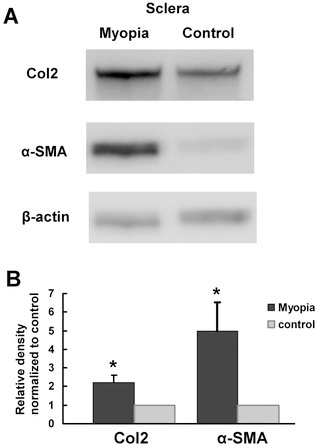
 Figure 5 of
Wu, Mol Vis 2015; 21:138-147.
Figure 5 of
Wu, Mol Vis 2015; 21:138-147.