Figure 3. After SSPCs were treated with different concentrations of TGF-β in culture, real-time PCR detected a dose-dependent increase
in α-SMA and Col2 mRNA normalized to the β-actin expression. Data are expressed as the fold change over the control sample,
as determined by the delta-delta Ct method. Bars, SD * represents statistically significant (p<0.05).
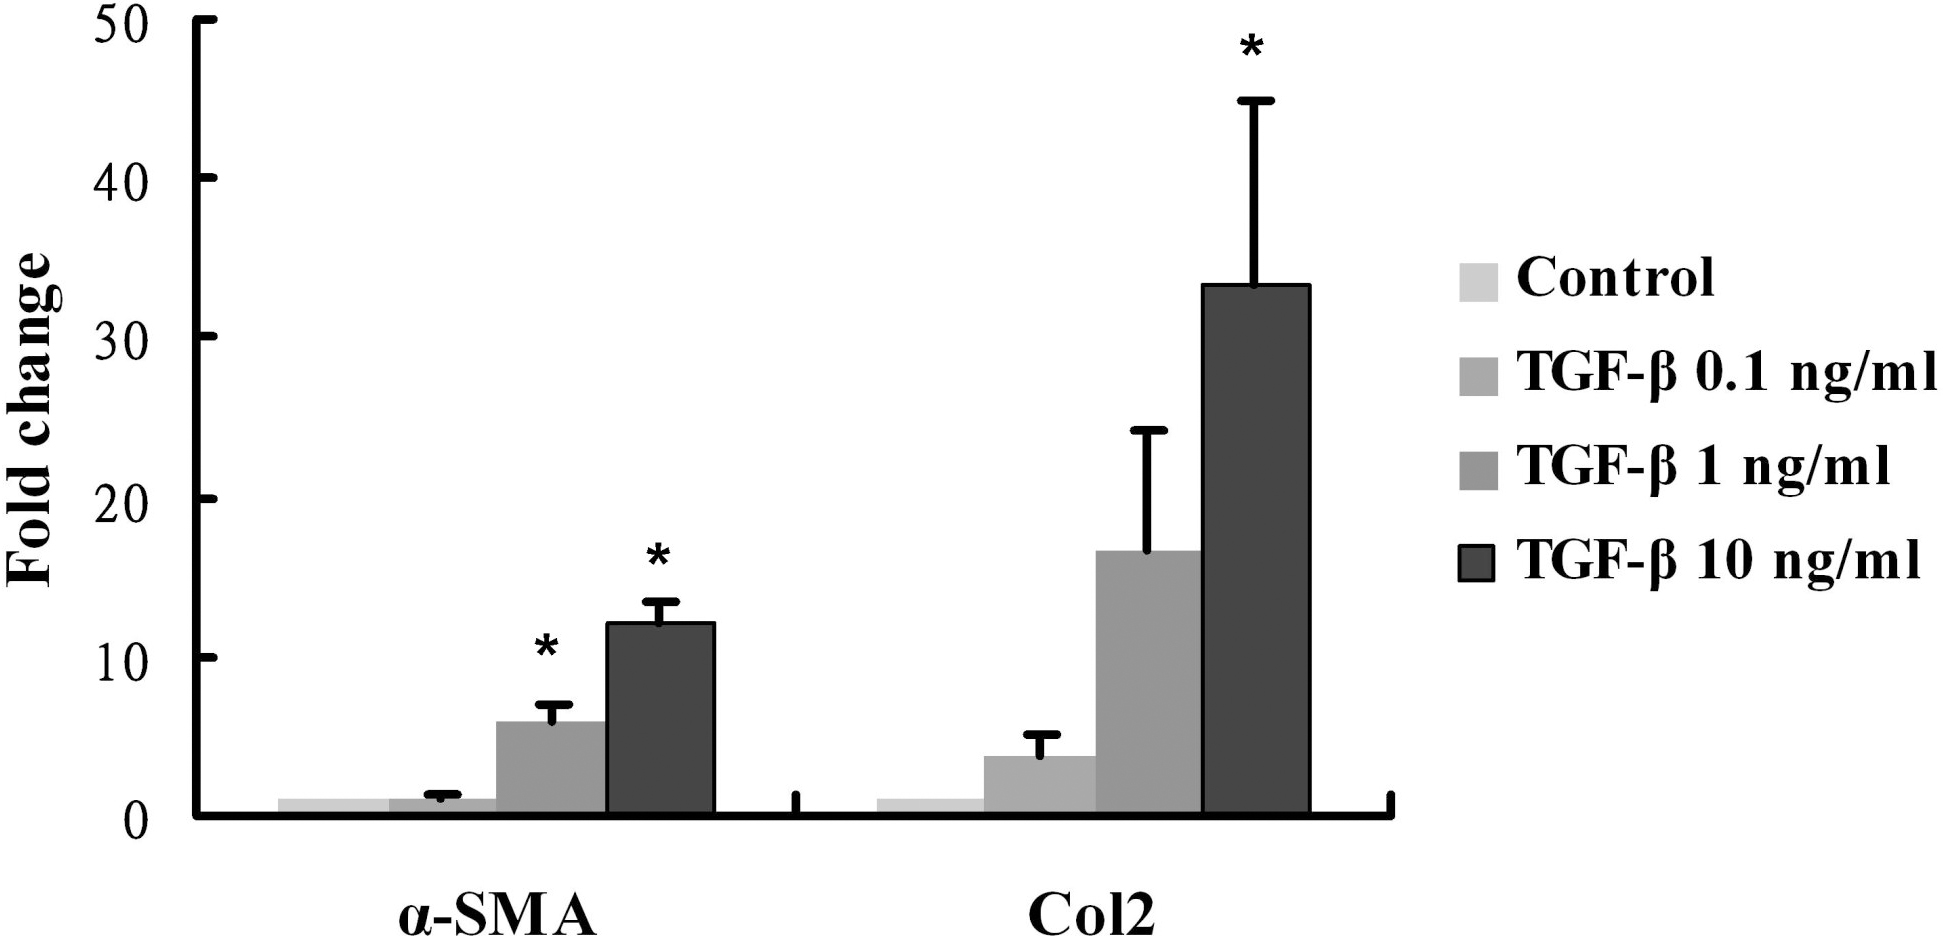
 Figure 3 of
Wu, Mol Vis 2015; 21:138-147.
Figure 3 of
Wu, Mol Vis 2015; 21:138-147.