Figure 2. Relative nidogen-1, nidogen-2, and perlecan mRNA levels. Cells were treated under different culture conditions in the presence
and absence of serum and growth factors. SF is serum free. Nidogen-1 and nidogen-2 mRNAs were most highly expressed in cells
grown in SF medium (keratocytes) whereas perlecan was most highly expressed in cells grown in the presence of transforming
growth factor (TGF)-β1 (myofibroblasts; n=3; ***, p<0.001; **, p<0.01).
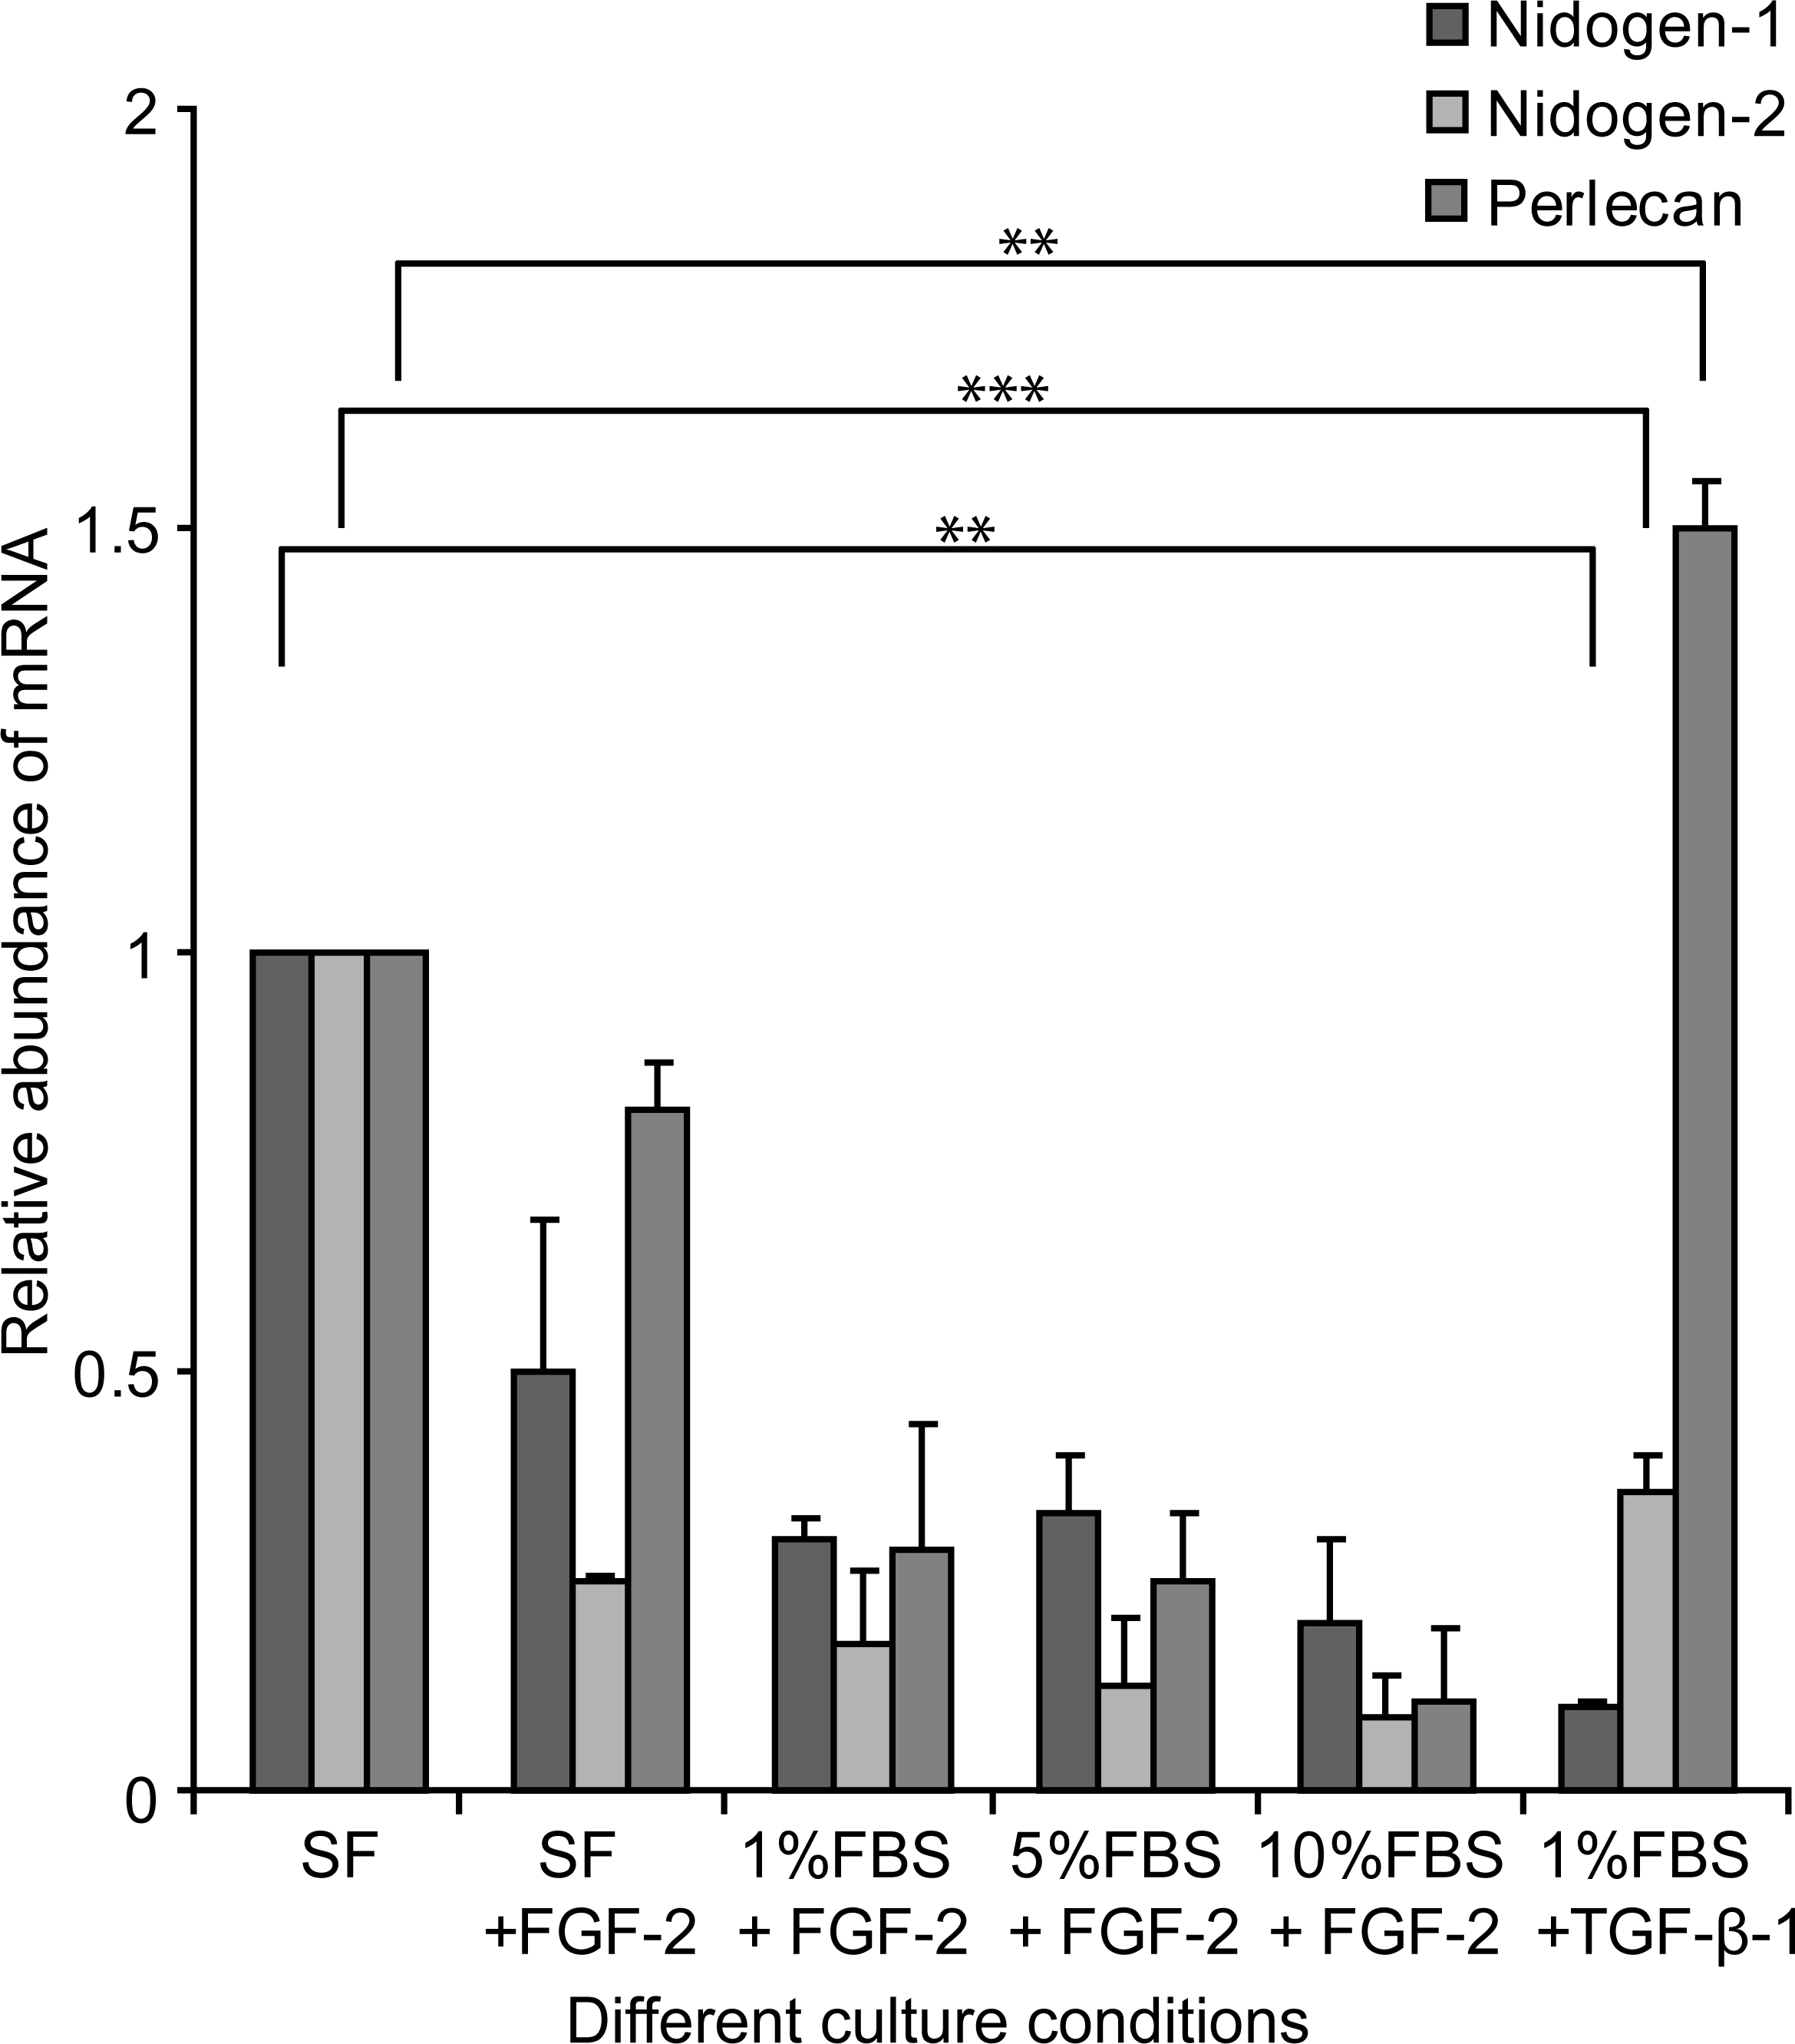
 Figure 2 of
Santhanam, Mol Vis 2015; 21:1318-1327.
Figure 2 of
Santhanam, Mol Vis 2015; 21:1318-1327.