Figure 5. Correlation network of the differentially expressed miRNAs. The blue circle represents genes, and the red rectangle represents
upregulated miRNAs, while the green rectangle represents downregulated miRNAs. The arrow denotes the direct interaction between
miRNA and its target gene.
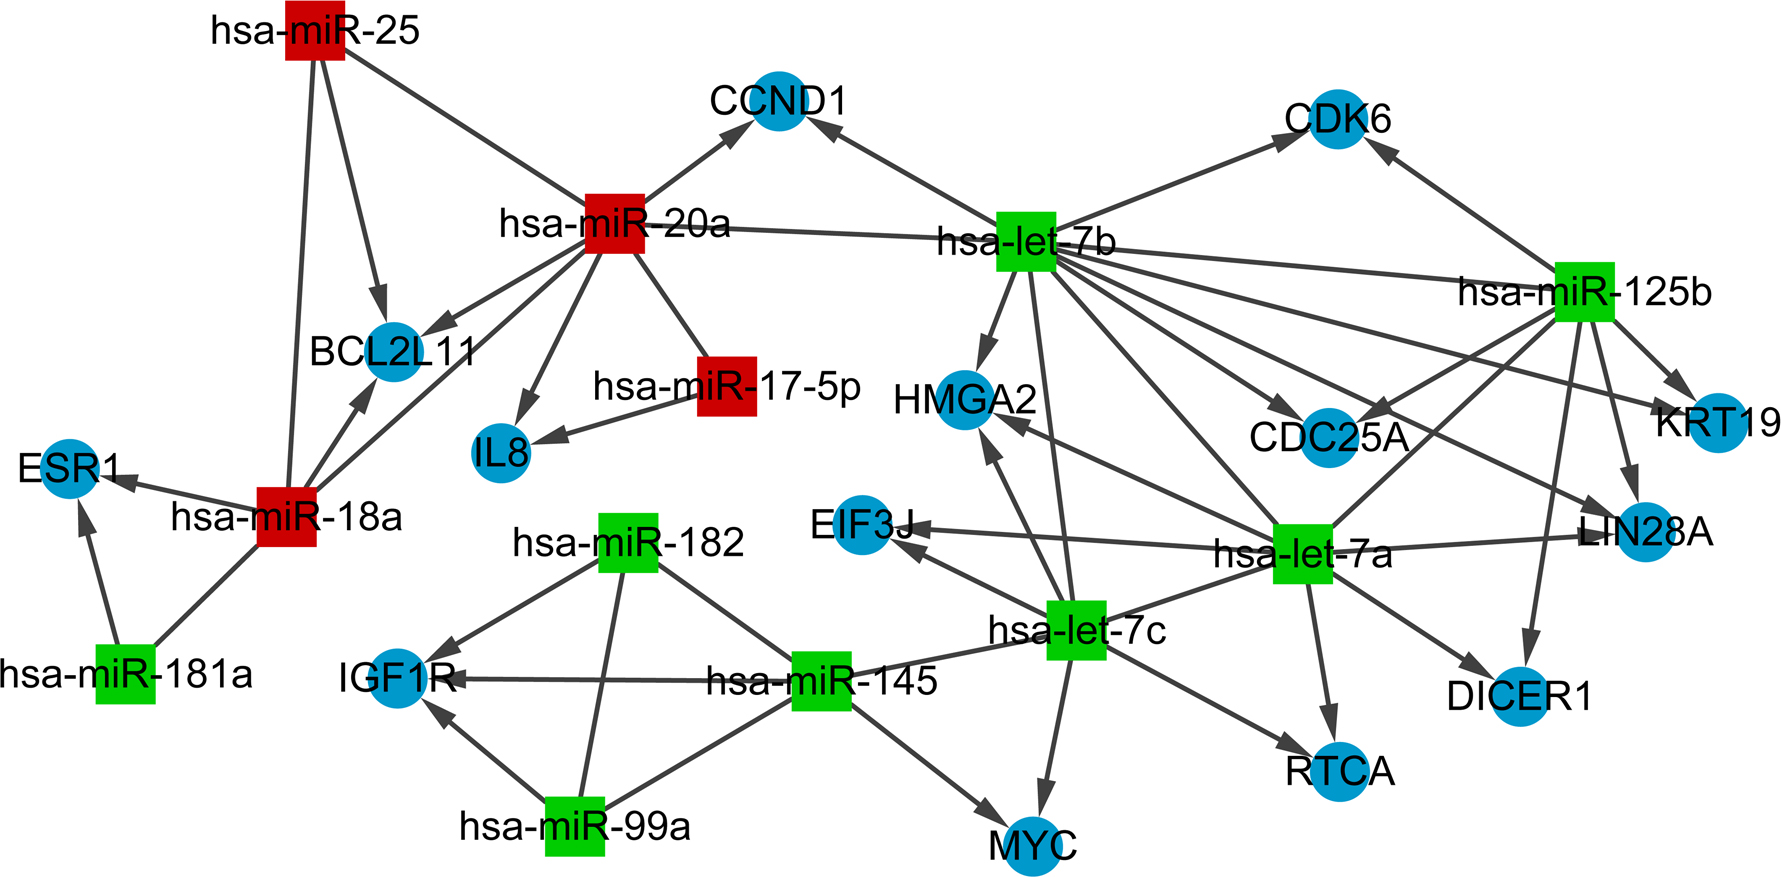
 Figure 5 of
Yang, Mol Vis 2015; 21:1307-1317.
Figure 5 of
Yang, Mol Vis 2015; 21:1307-1317.