Figure 4. Clustering analysis of the 14 differentially expressed miRNAs in two types of samples. Healthy 1–3 denote the healthy retina
samples, and Rb 1–3 denote the retinoblastoma samples. The values on the edges of the clusters are p values (%). The red values
are approximately unbiased (au) p values, and the green values are bootstrap probability (bp) values. Clusters with au larger
than 95% are highlighted by rectangles, which are strongly supported by data.
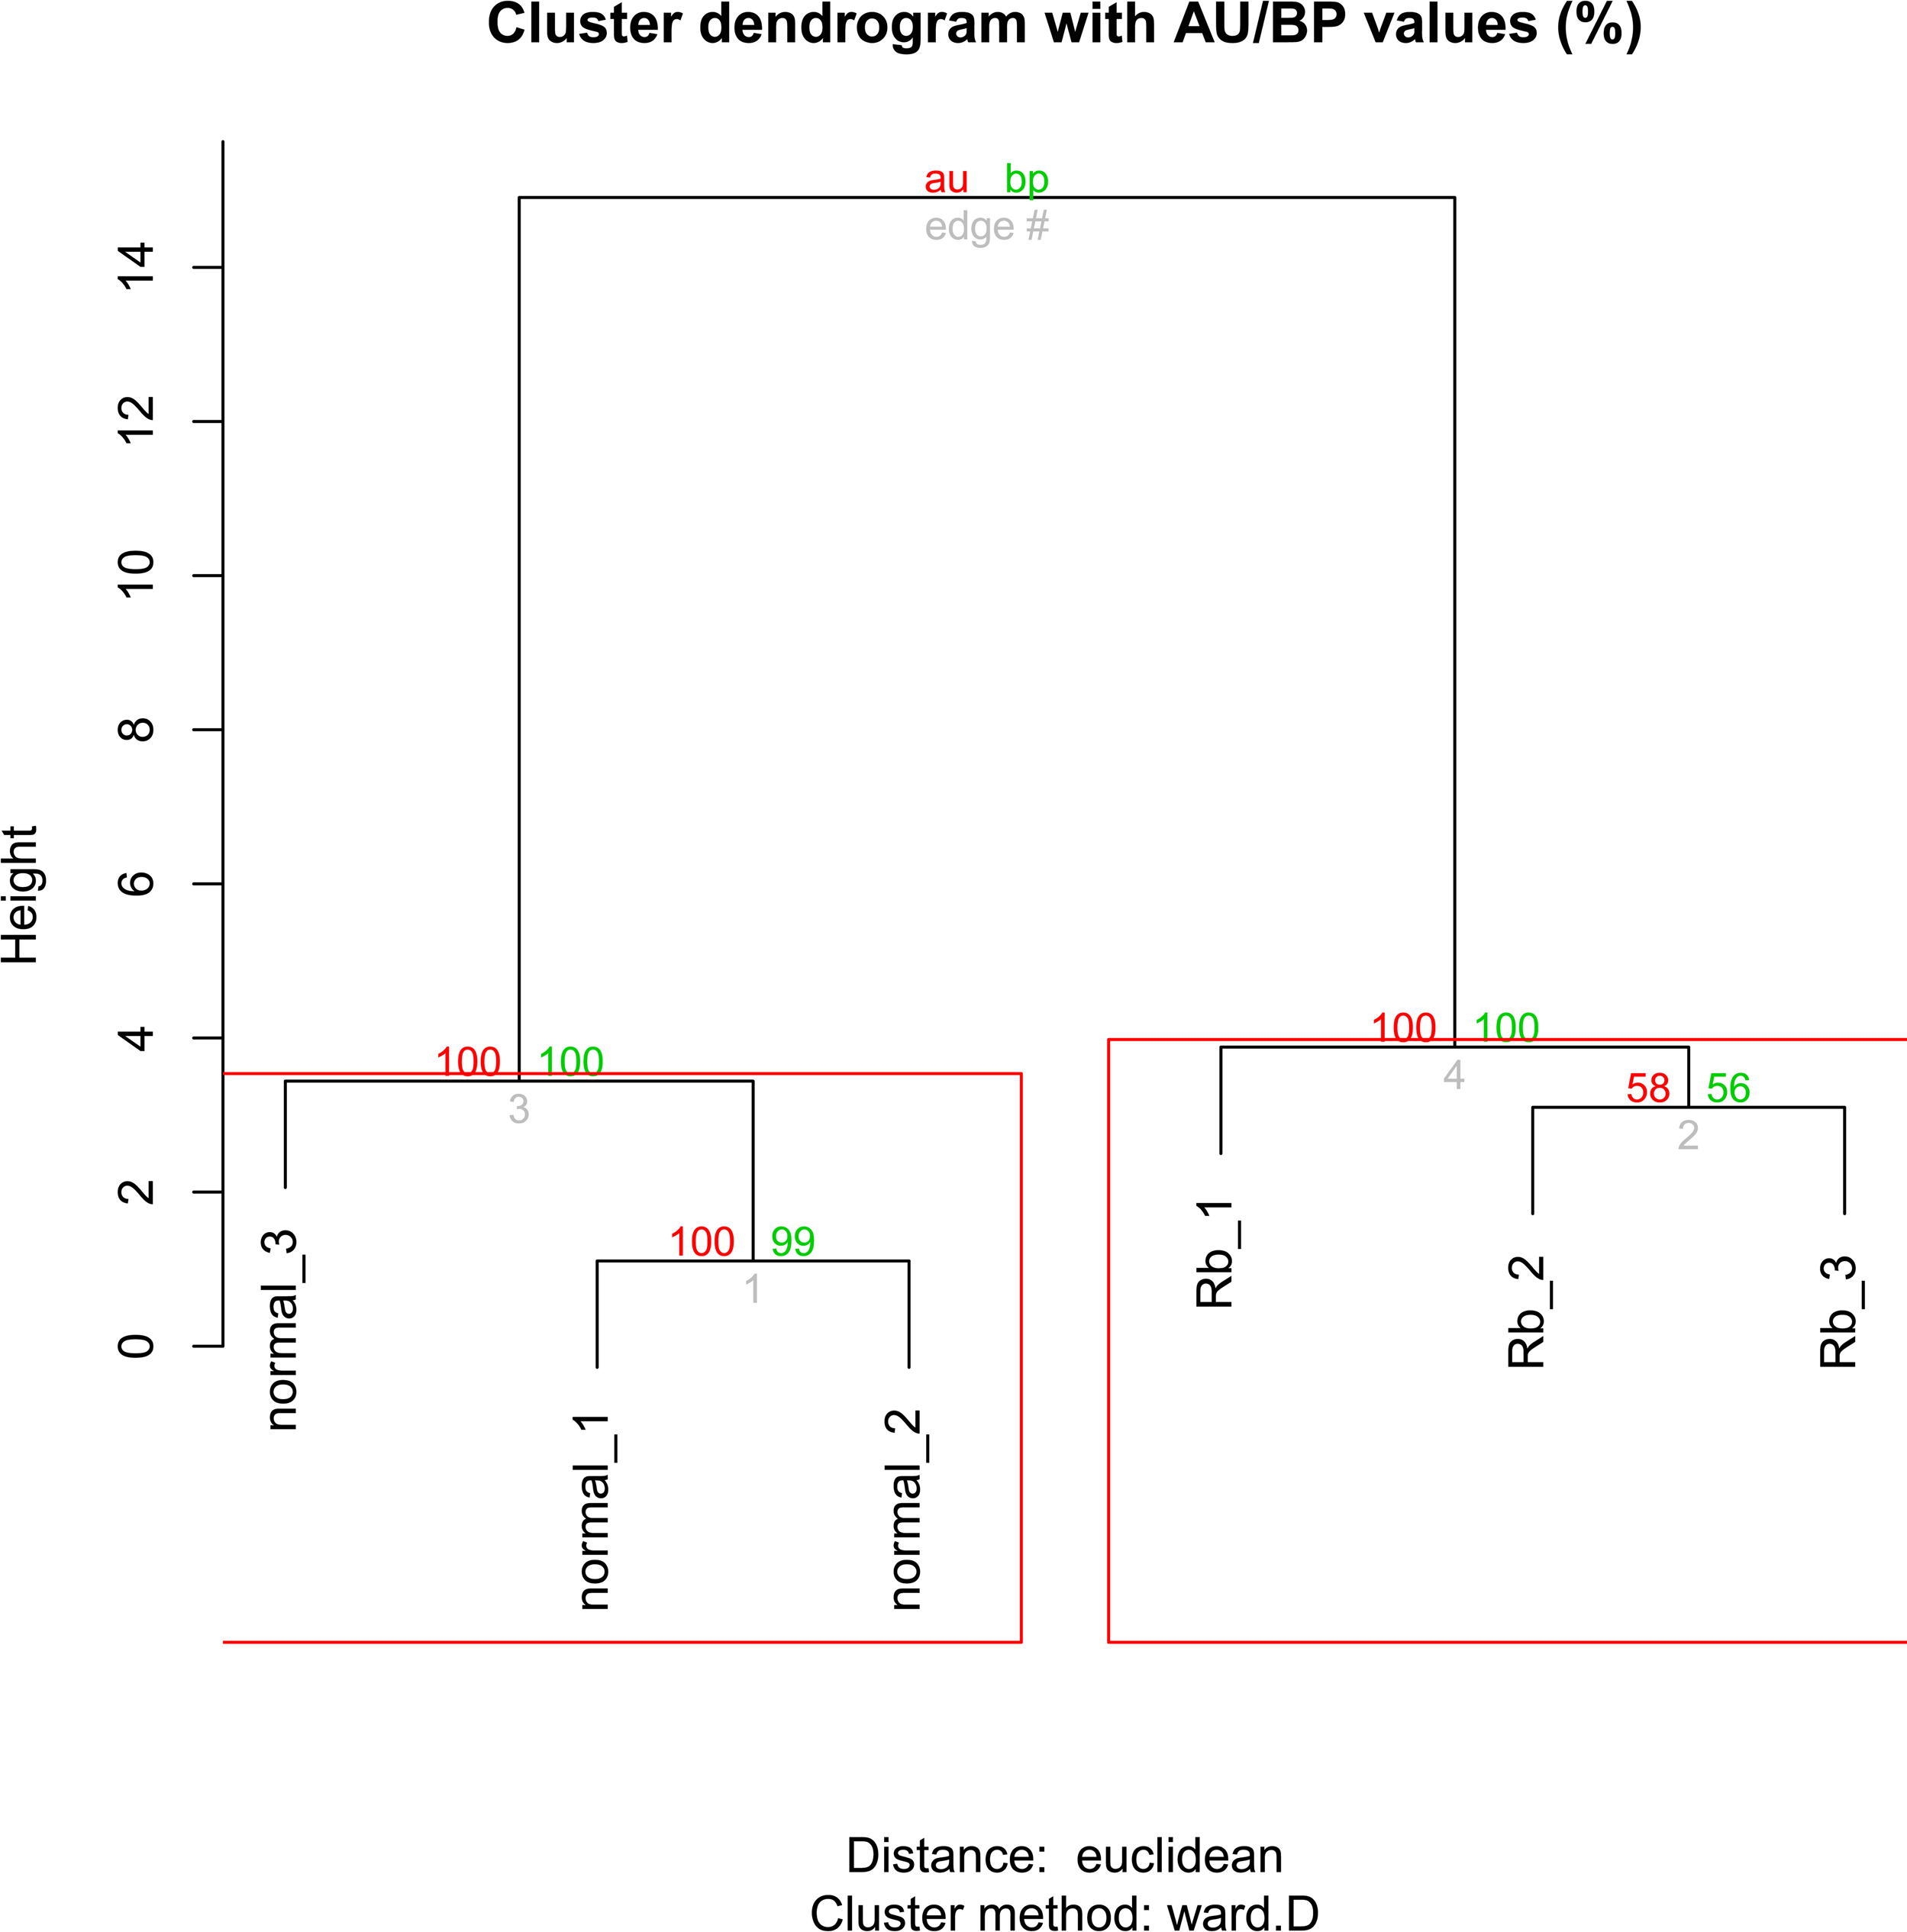
 Figure 4 of
Yang, Mol Vis 2015; 21:1307-1317.
Figure 4 of
Yang, Mol Vis 2015; 21:1307-1317.