Figure 3. Integrated miRNA–target regulatory network. The blue circle represents genes, and the red rectangle represents upregulated
miRNAs, while the green rectangle represents downregulated miRNAs. Arrows denote direct interactions between a miRNA and its
target gene.
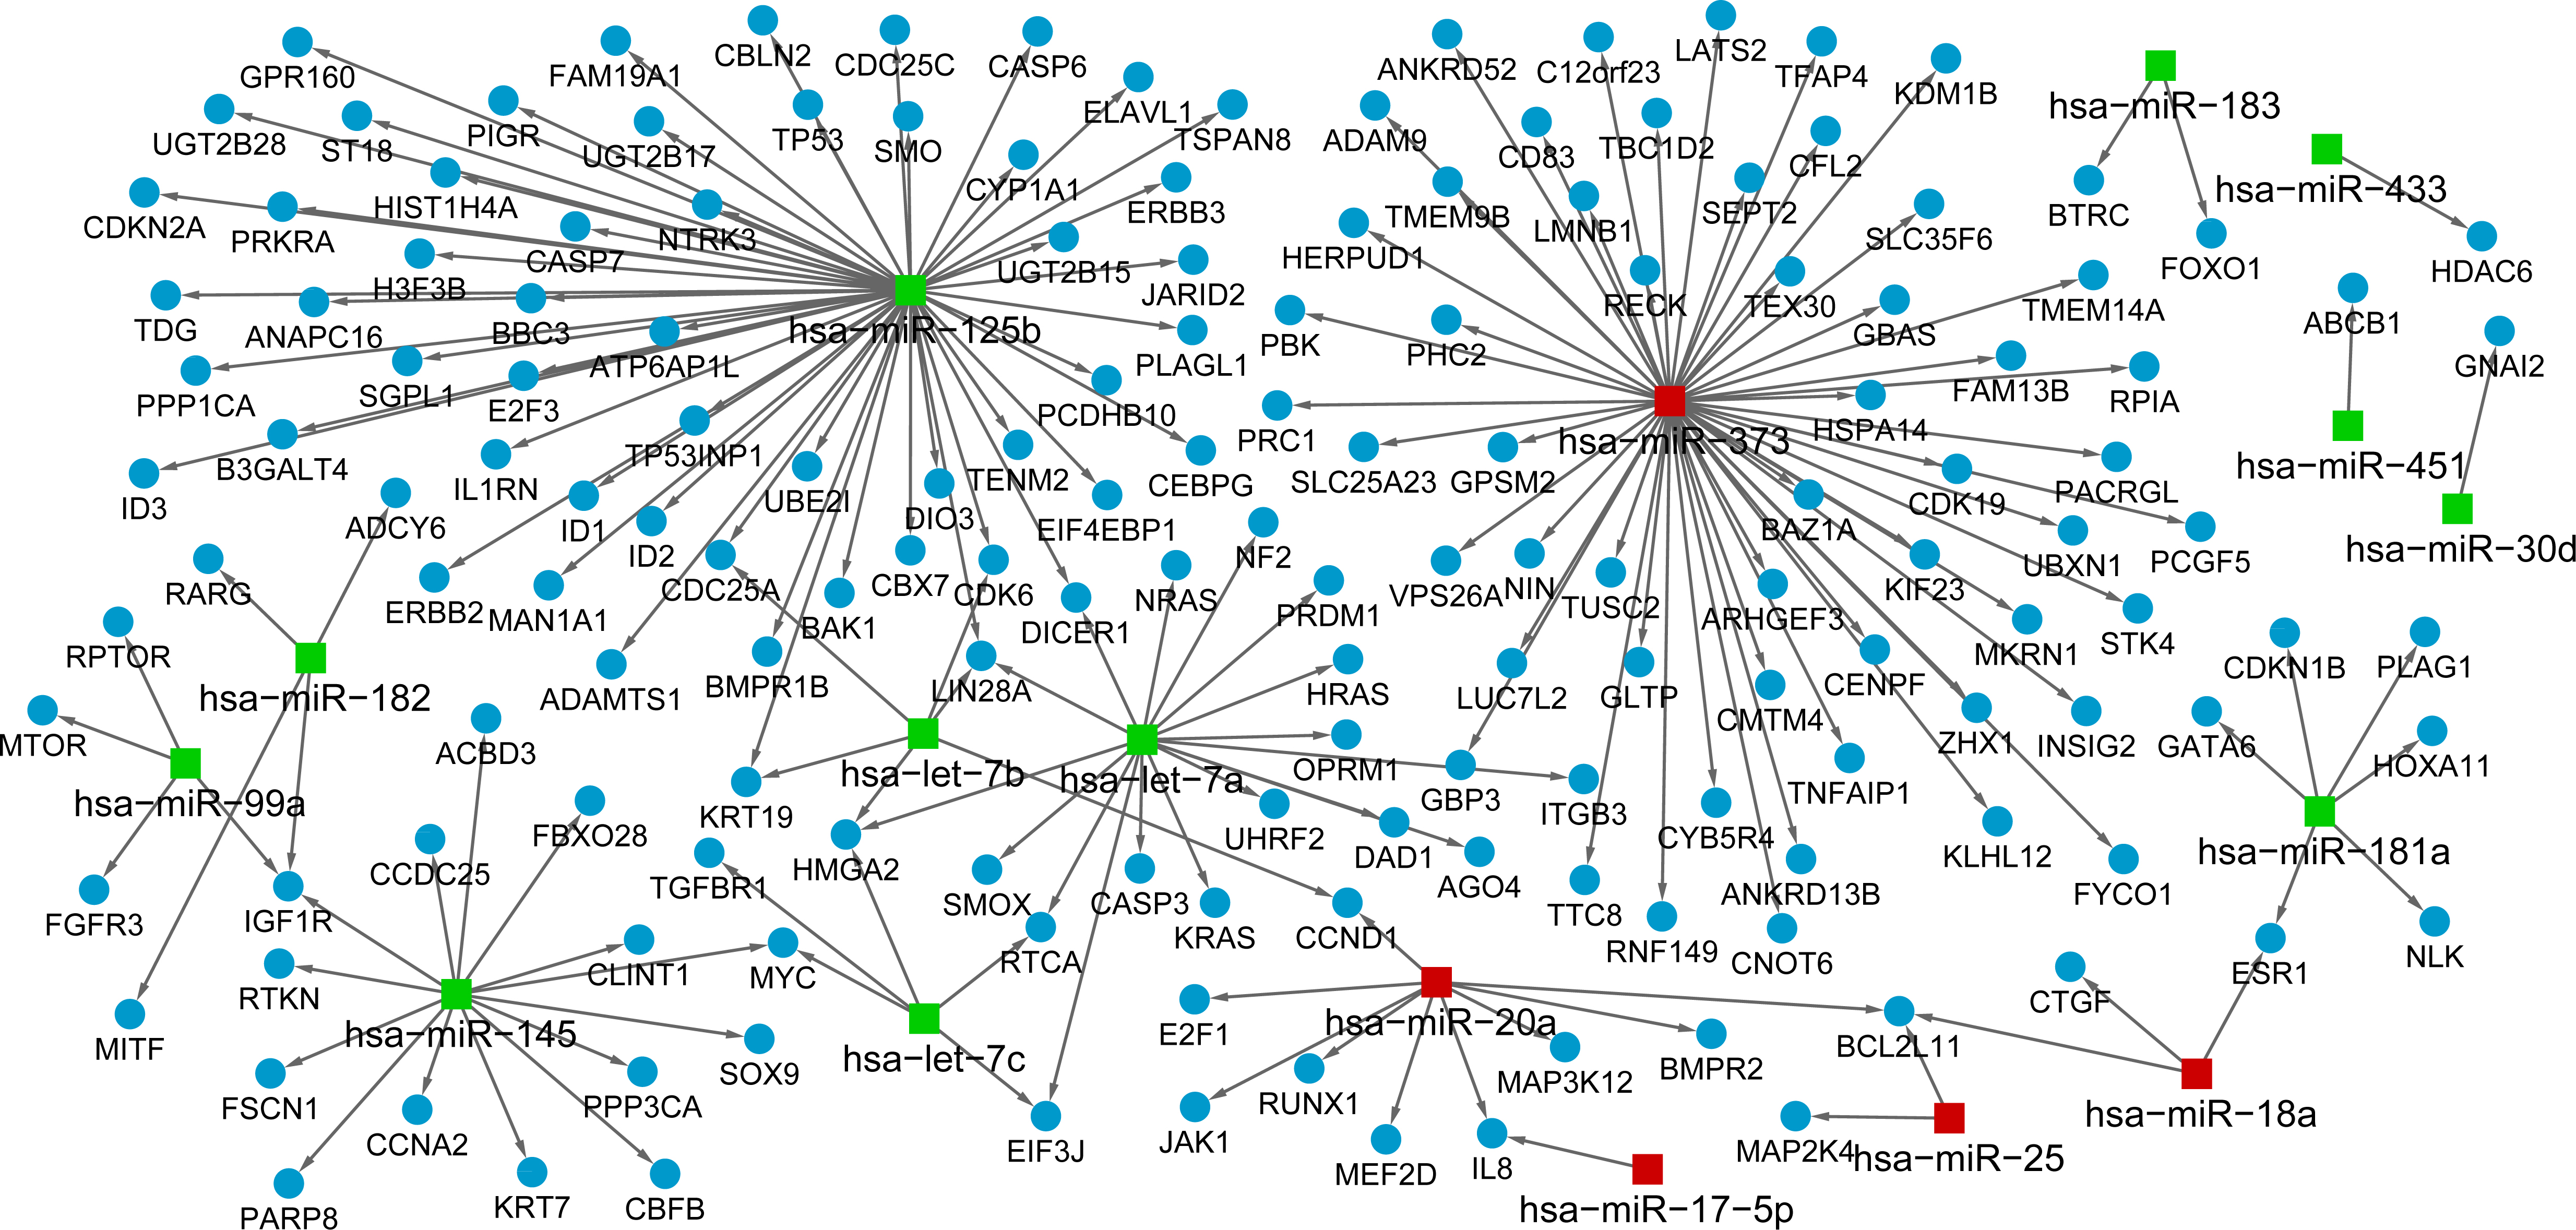
 Figure 3 of
Yang, Mol Vis 2015; 21:1307-1317.
Figure 3 of
Yang, Mol Vis 2015; 21:1307-1317.