Figure 2. Heat map of the clustering analysis of differentially expressed miRNAs between two samples. The x-axis represents the samples
(healthy 1–3 denote healthy retina samples, and Rb 1–3 denote retinoblastoma samples), and the y-axis represents miRNAs.
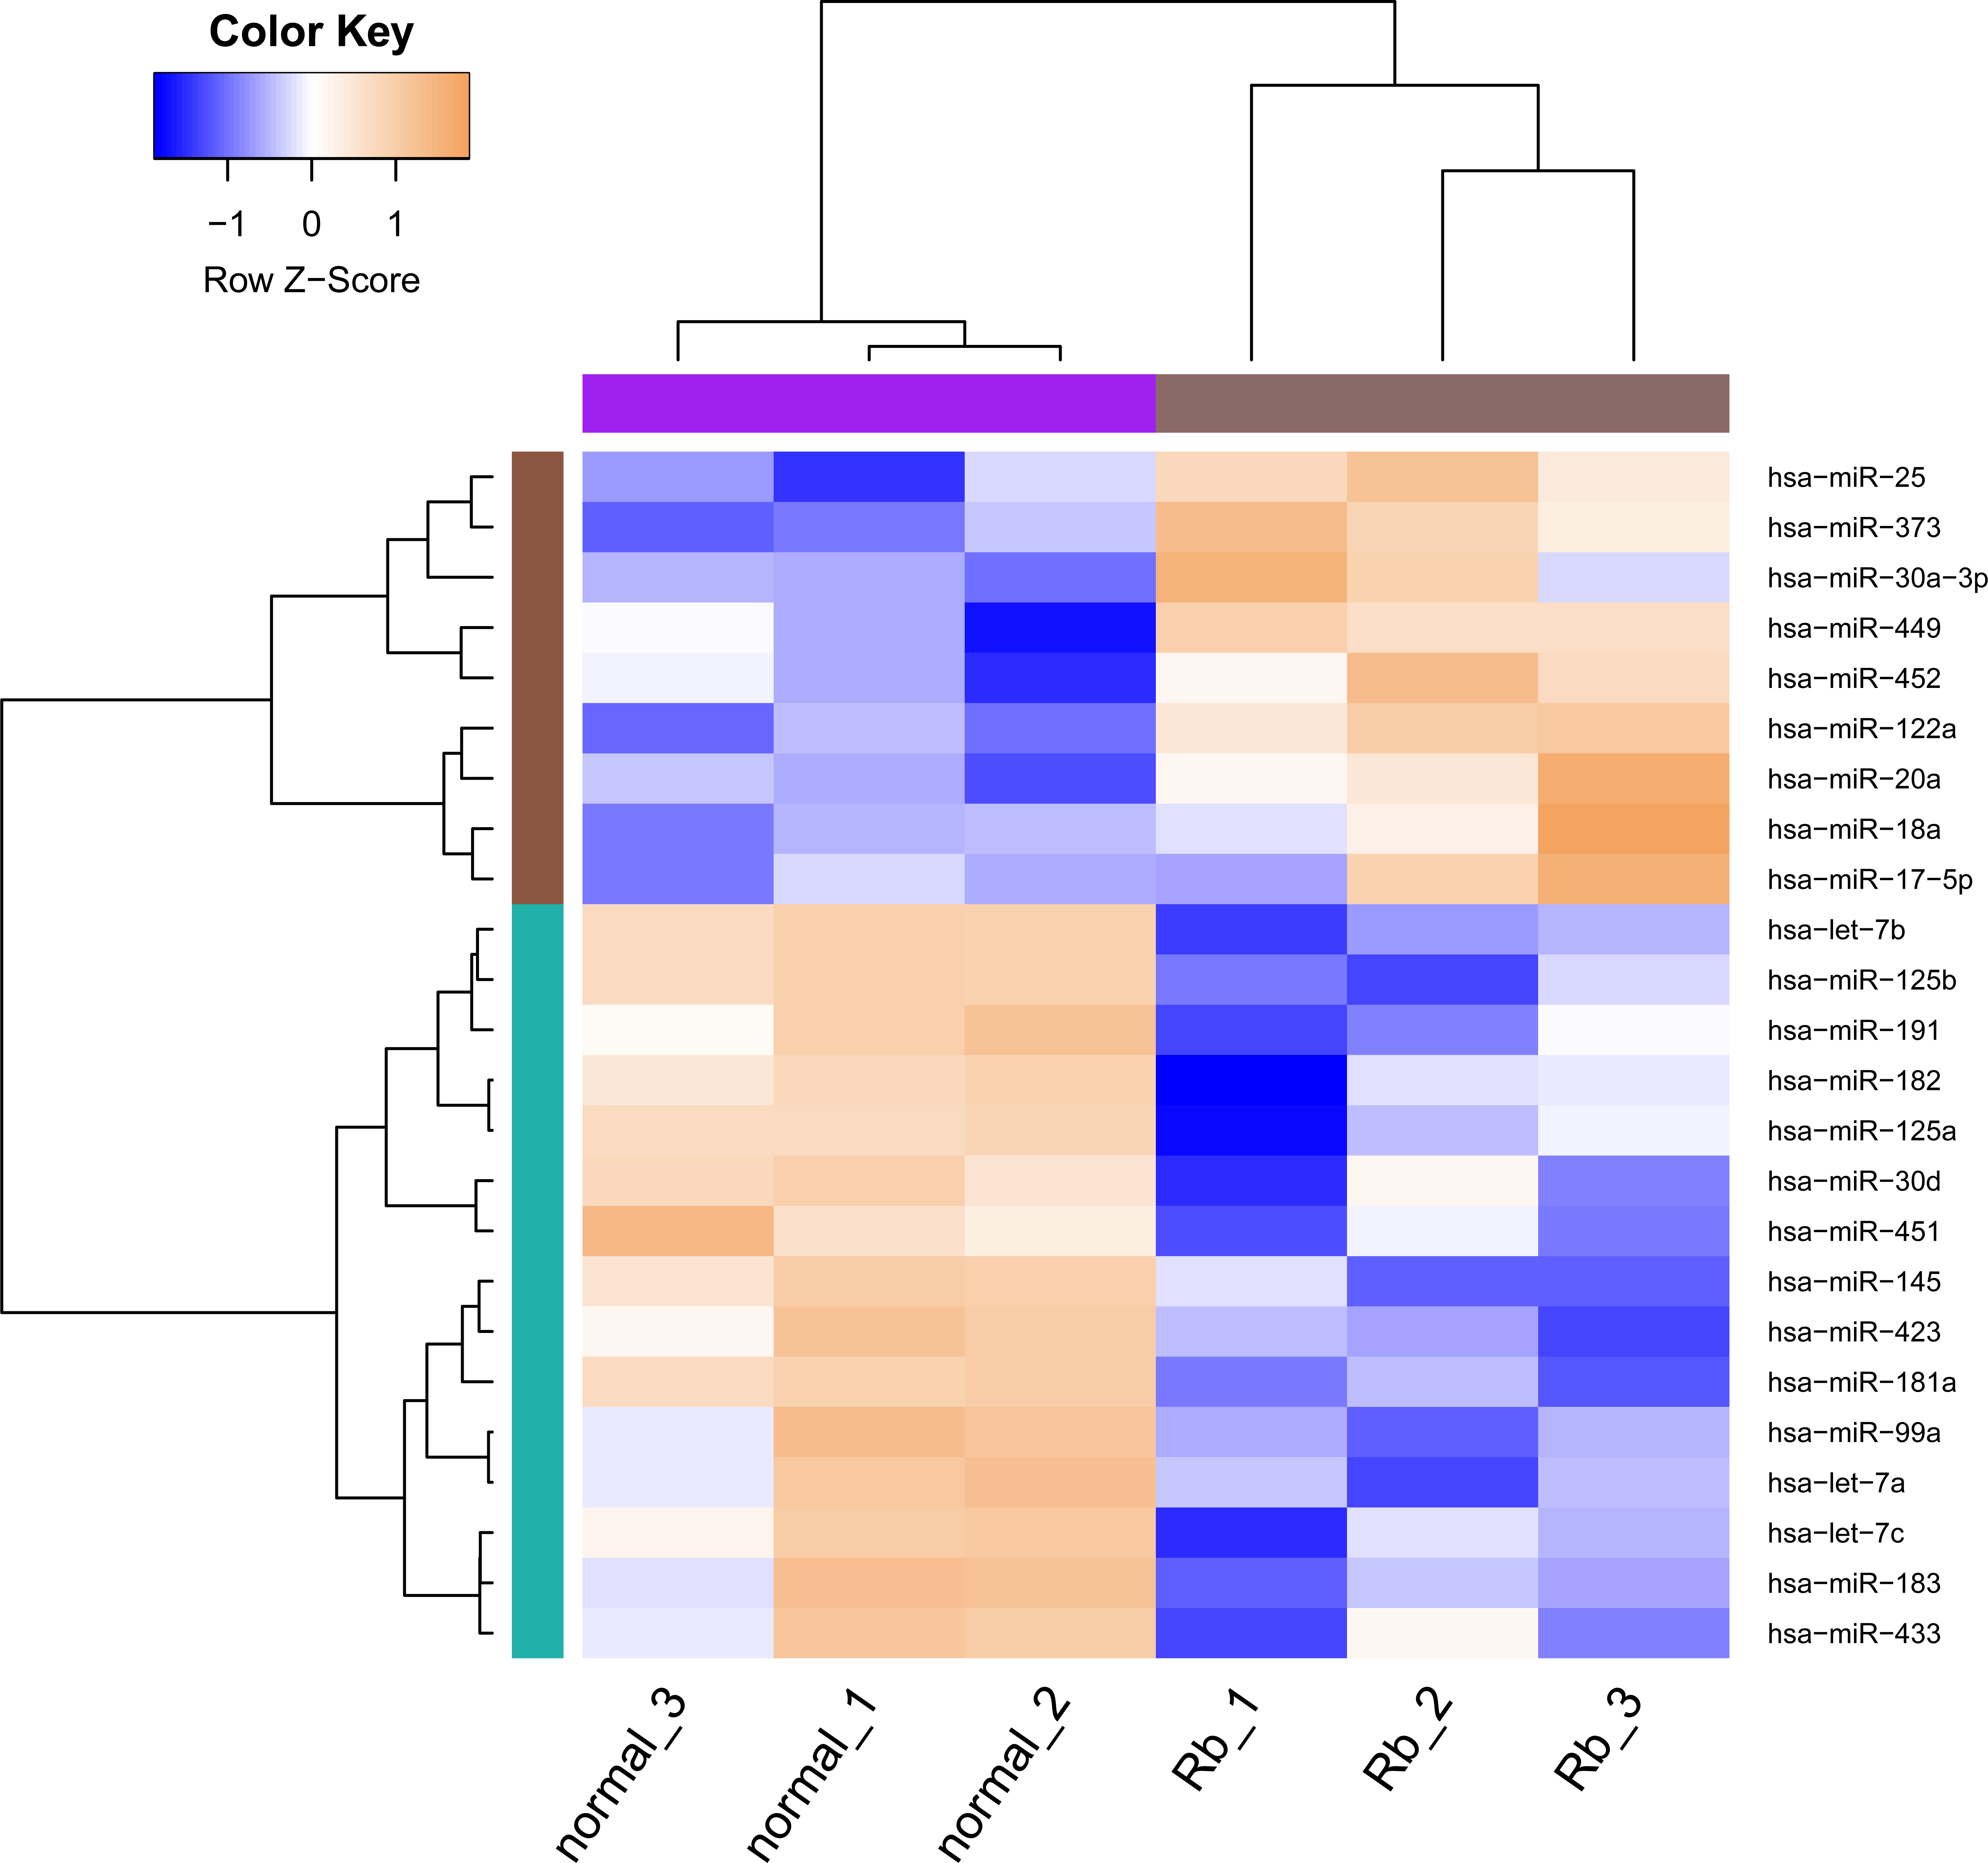
 Figure 2 of
Yang, Mol Vis 2015; 21:1307-1317.
Figure 2 of
Yang, Mol Vis 2015; 21:1307-1317.