Figure 3. Clinical imaging and mf-ERG testing of affected individuals from family TB126. A, B: Fundus photographs of the right and left eyes of individual II-1, respectively, showing severe atrophic changes in the retina
with bull’s-eye maculopathy. C: Fundus photograph of the right eye of individual II-4, showing diffuse pigmentary granularity and depigmented areas. D, E: Spectral domain-optical coherence tomography (SD-OCT) of the right and left eyes of individual II-1, respectively, showing
thinning of the retina, with loss of the photoreceptor layer and atrophy of the RPE. F: SD-OCT of the right eye of individual II-4, showing thinning of the inner retinal layers, irregularity of the photoreceptor
cell layer, and thinning of the RPE. G, H: SD-OCT of the right and left eyes of individual II-3, respectively, showing thinning of the inner retinal layers and irregularity
of the photoreceptor cell layer. I: Multifocal electroretinography (mf-ERG) recordings of individual II-3, using bipolar Burian-Allen corneal electrodes. The
stimulus consisted of 103-hexagon array, which stimulated the central 80° of the retina, and has maximum illumination of 1,000
cd/m2. Foveal response amplitudes are severely reduced, while peripheral responses (starting from 10° radius from fixation point)
are better preserved but demonstrate severe amplitude reduction and delay in implicit times. J: mf-ERG recordings in individual II-4, using a Dawson, Trick, and Litzkow (DTL) electrode. The stimulus consisted of a 37-hexagon
array with a maximum intensity of 1,000 cd/m2, which stimulated the central 48° of the retina. Response amplitudes are severely reduced in all retinal regions. Central
response amplitudes are more severely reduced, with relative preservation of response amplitudes in the peripheral nasal retina
(12° radius from the fixation point).
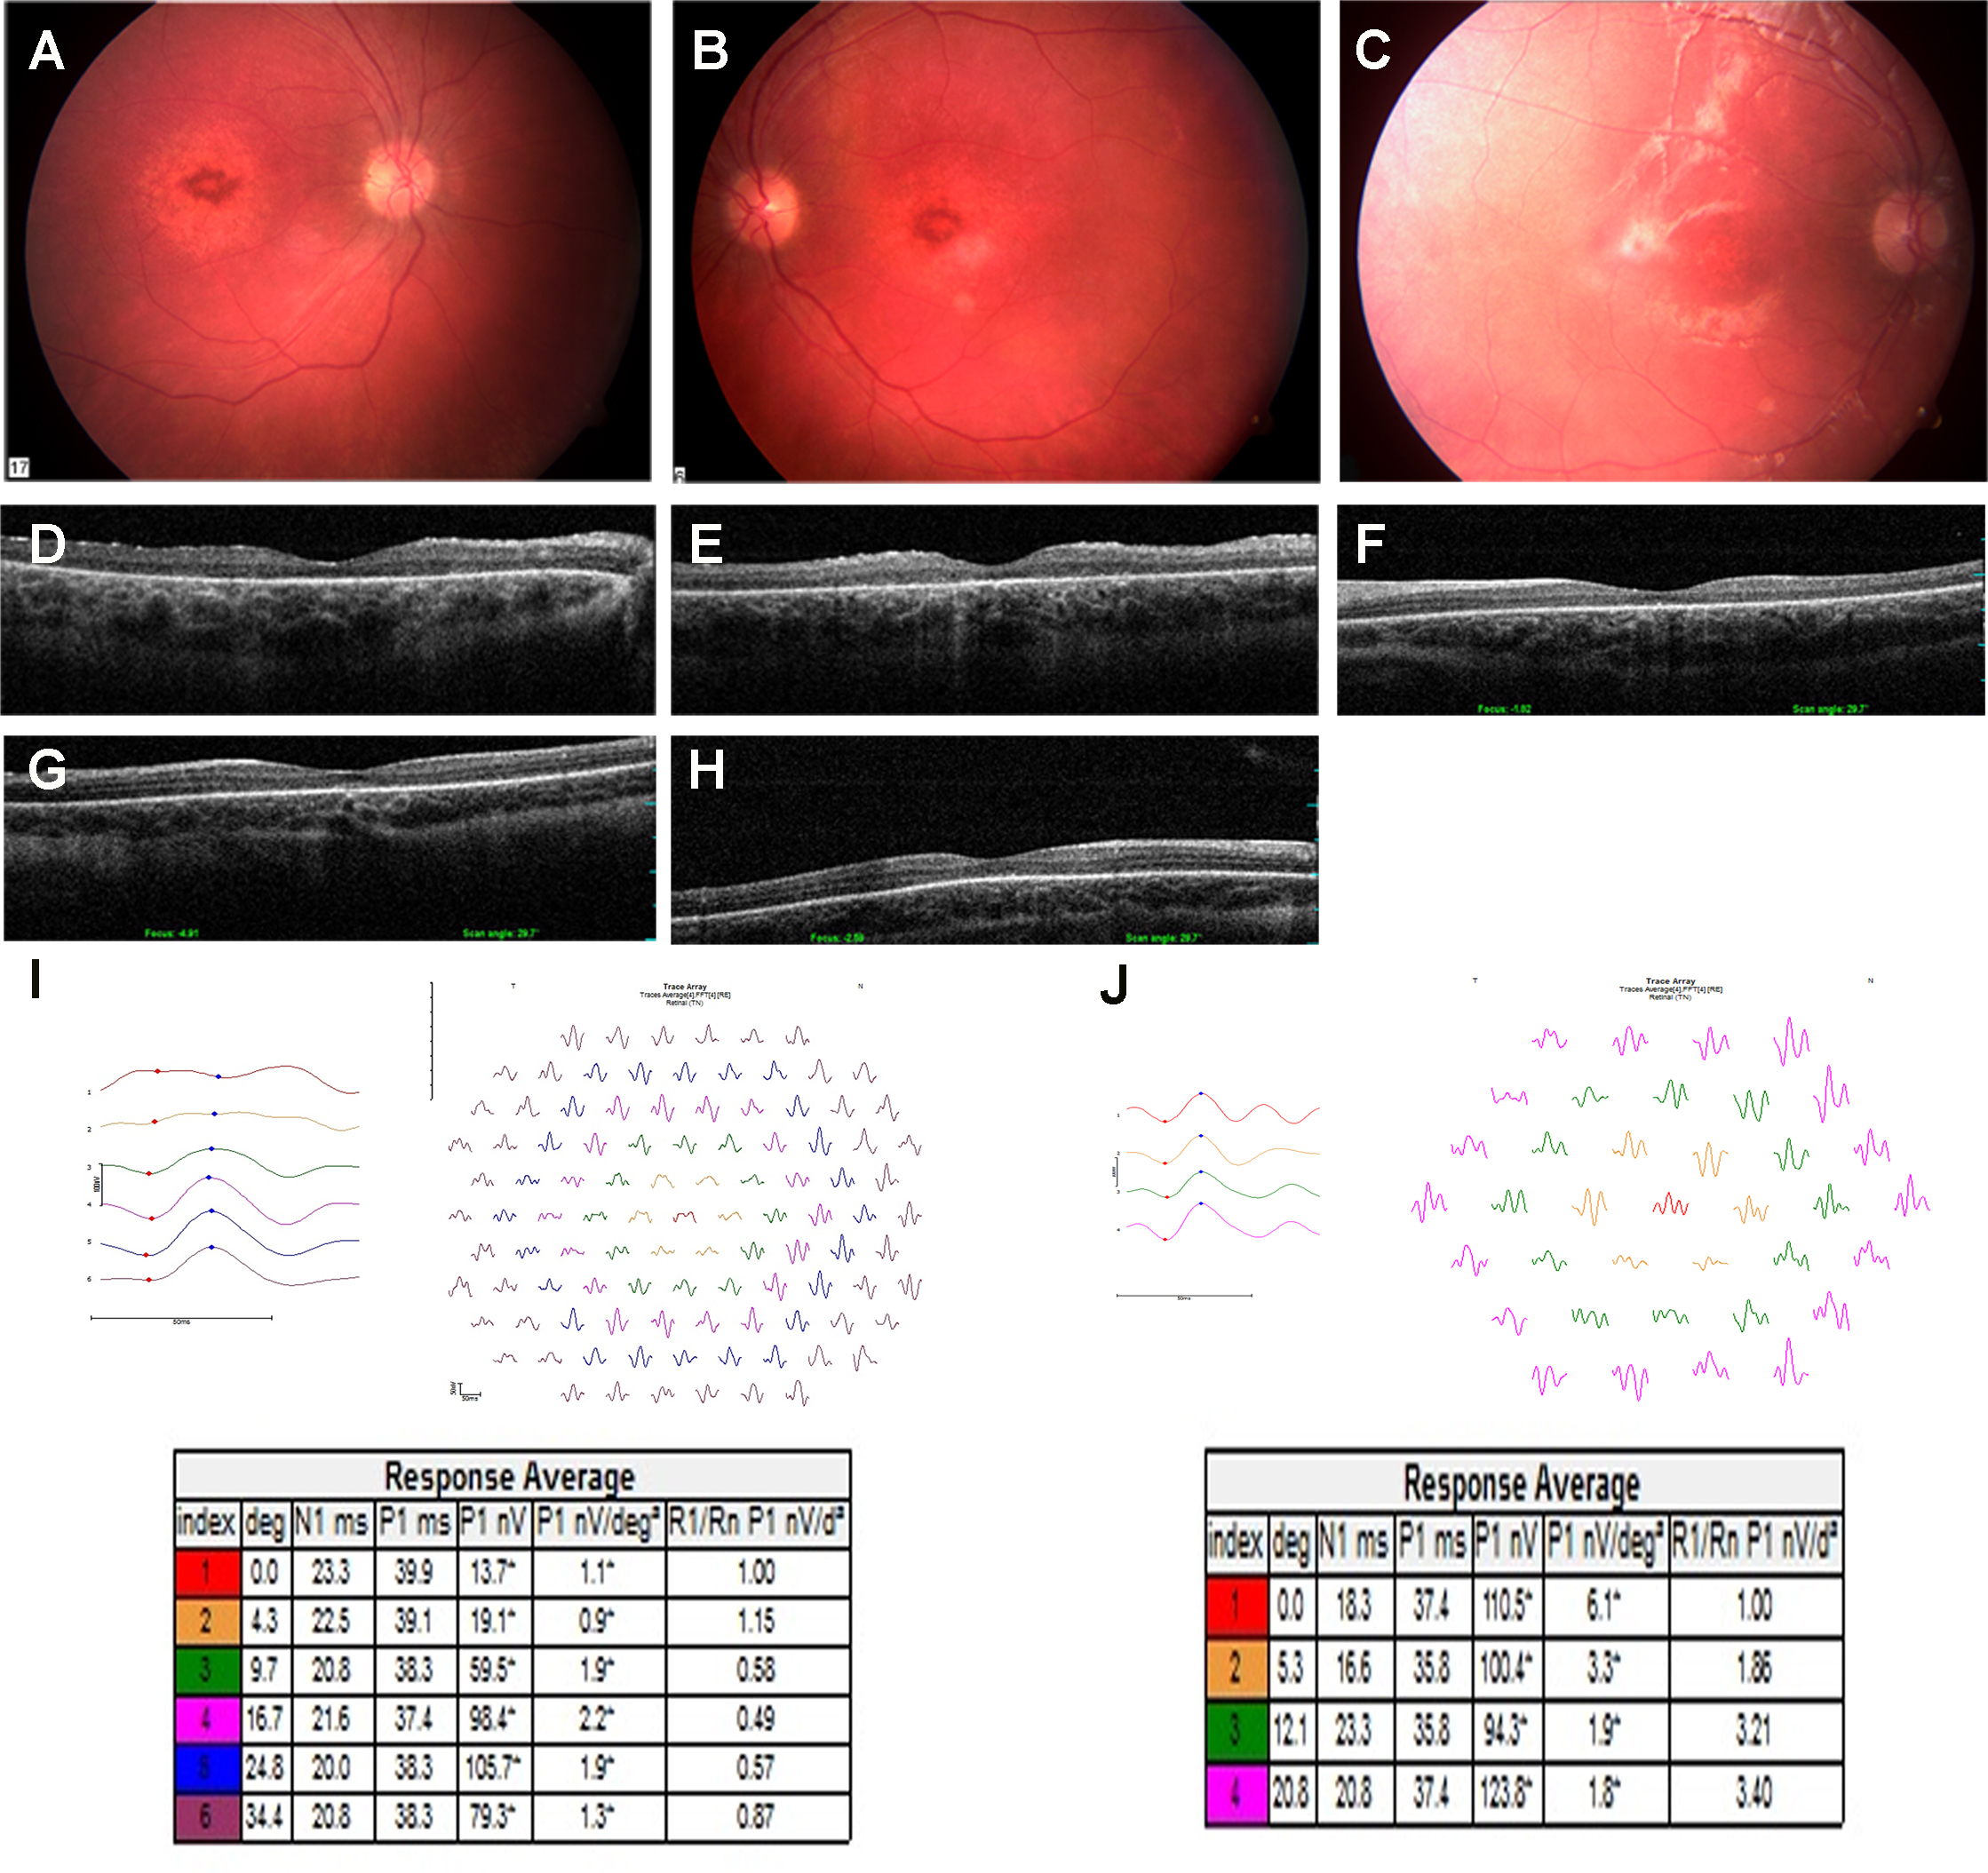
 Figure 3 of
Eidinger, Mol Vis 2015; 21:1295-1306.
Figure 3 of
Eidinger, Mol Vis 2015; 21:1295-1306.