Figure 3 of
Gupta, Mol Vis 2015; 21:1252-1260.
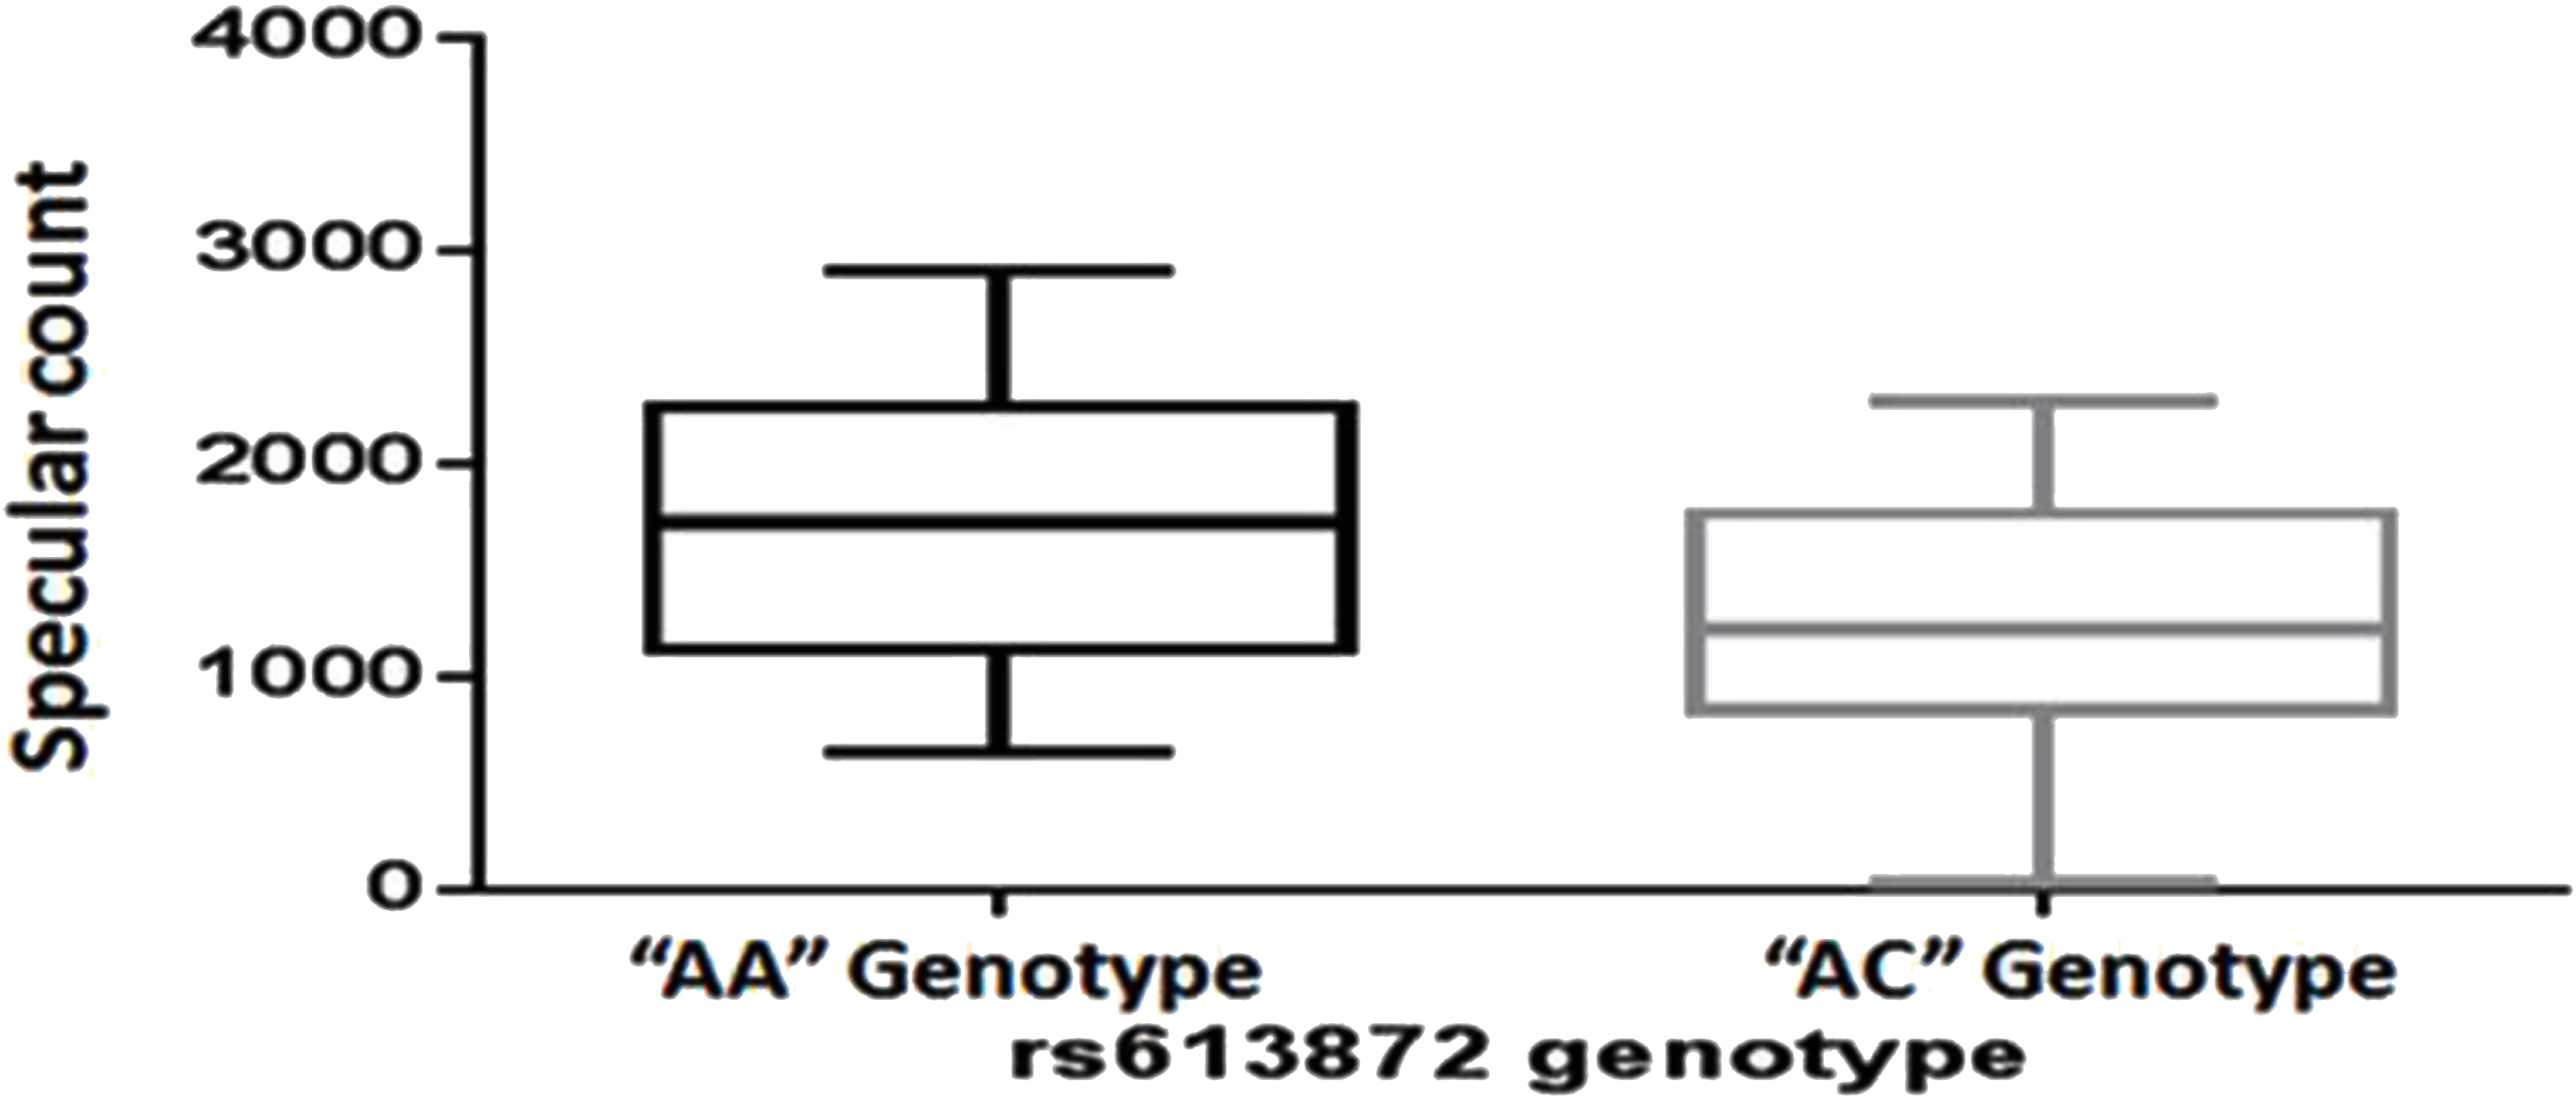
Figure 3.
Difference in specular count between
TCF
rs613872 genotypes AA and AC as shown with an unpaired Student
t
test (p=0.0259, ≤0.05).
 Figure 3 of
Gupta, Mol Vis 2015; 21:1252-1260. Figure 3 of
Gupta, Mol Vis 2015; 21:1252-1260.
Figure 3 of
Gupta, Mol Vis 2015; 21:1252-1260. Figure 3 of
Gupta, Mol Vis 2015; 21:1252-1260.