Figure 6. Genome-wide Interval Map of Robo2. This genome-wide graph displays the quantitative trait loci (QTL) distribution across the Department of Defense (DoD) Congressionally
Directed Medical Research Programs (CDMRP) Normal Retina Database. The x-axis plots the locations of the QTLs that control
the transcript expression. Positions are measured in megabases from chromosome 1 to chromosome X (1–2,600 Mb). The y-axis plots the “likelihood ratio statistic” (LRS). The significant levels of individual QTLs are color-coded. The red line
represents a genome-wide significance level (p=0.05), and the gray line is suggestive. Notice the significant QTL on chromosome
16.
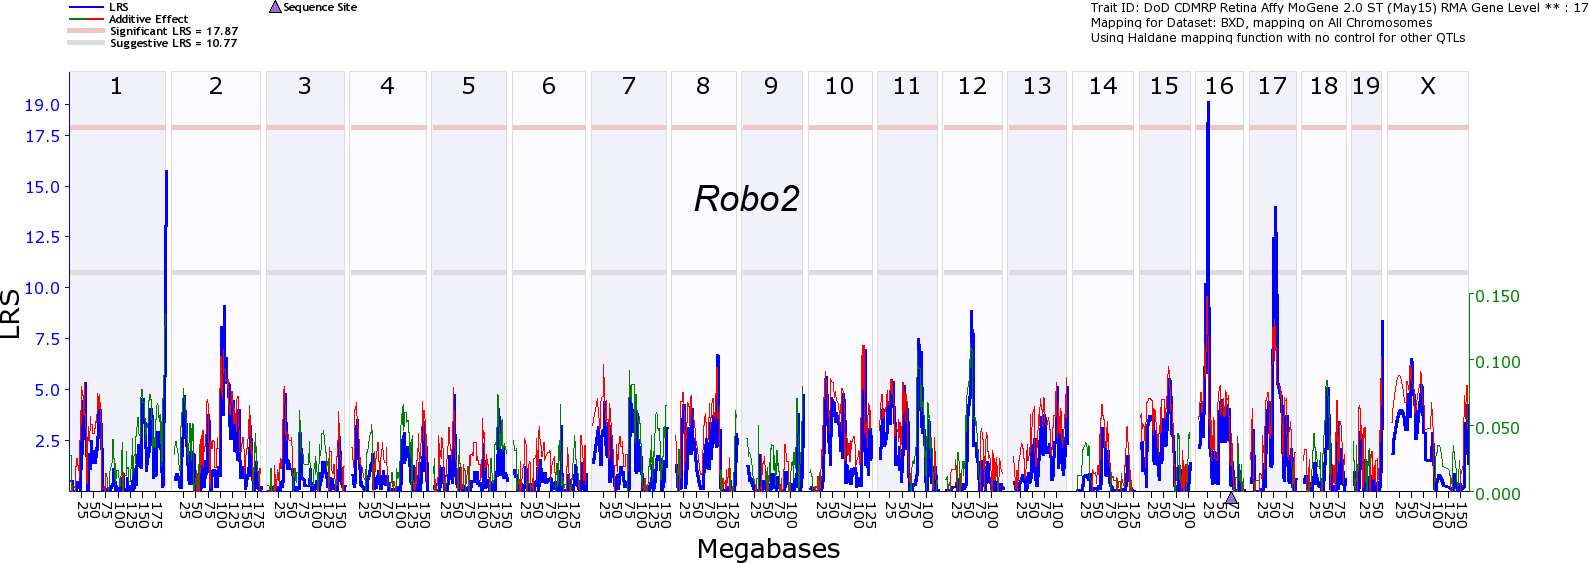
 Figure 6 of
King, Mol Vis 2015; 21:1235-1251.
Figure 6 of
King, Mol Vis 2015; 21:1235-1251.