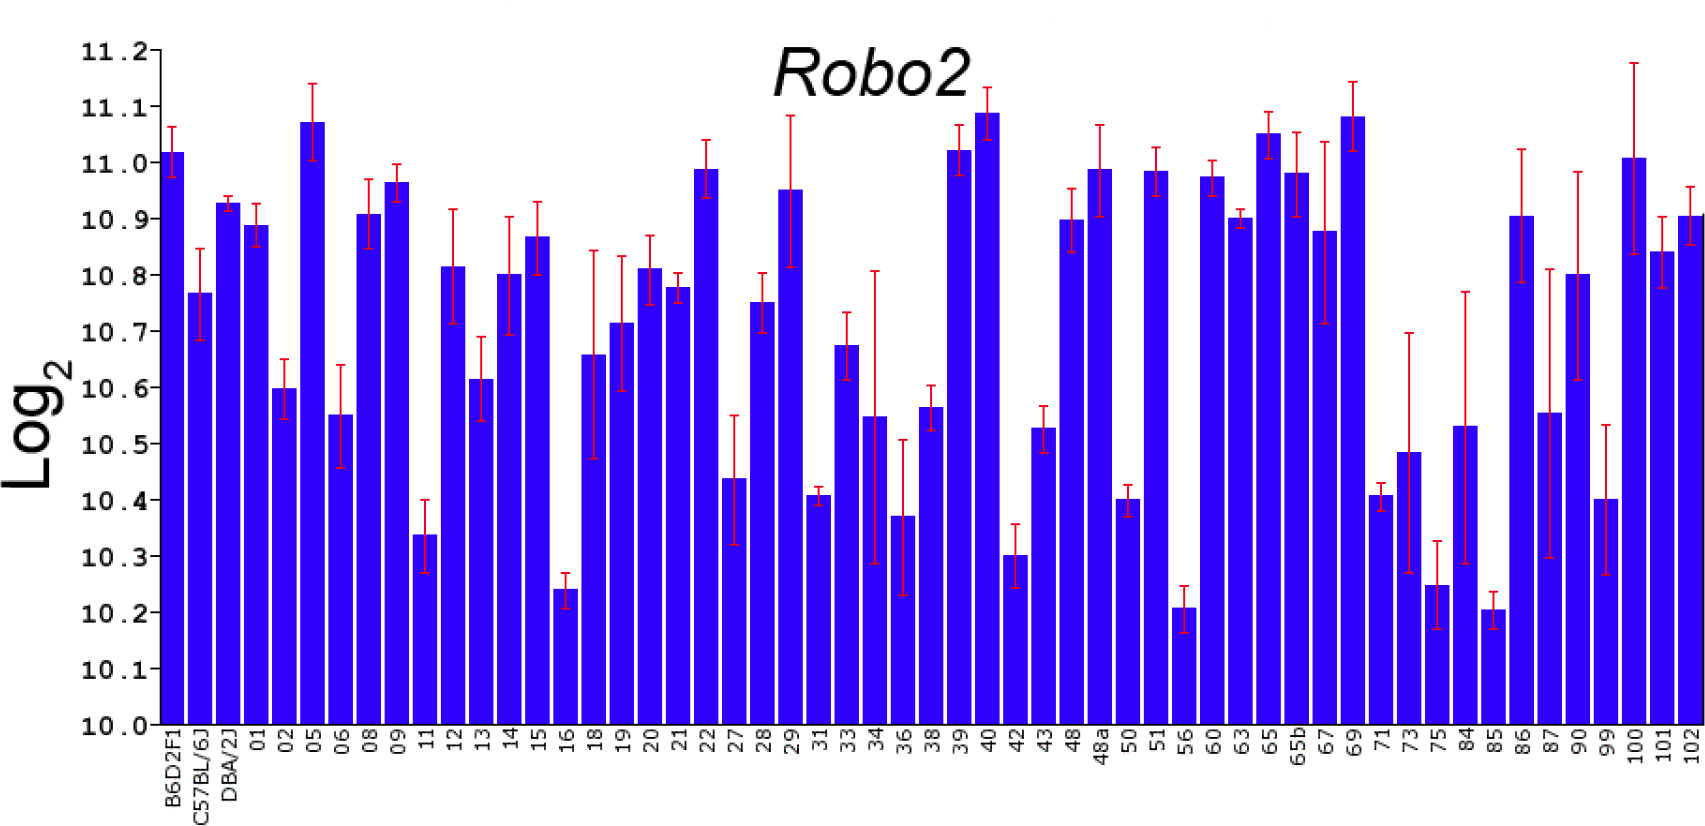
Figure 4. Expression of Robo2 across the BXD strains in the DoD CDMRP Normal Retina Database. The expression levels of Robo2 are shown for many of the BXD strains as the mean expression and the standard error of the mean. The individual strain identifications
are shown along the bottom of the plot, and the scale is log2. This variability from strain to strain indicates that the gene is differentially regulated by multiple genomic elements.

 Figure 4 of
King, Mol Vis 2015; 21:1235-1251.
  Figure 4 of
King, Mol Vis 2015; 21:1235-1251.