Figure 1. The expression at the gene level of Rpe65 across the BXD strains in the DoD CDMRP Normal Retina Database. The expression levels of Rpe65 are shown for many of the BXD strains as the mean expression and the standard error of the mean. The individual strain identifications
are shown along the bottom, and the scale is log2. Notice the low levels of Rpe65 in some stains (DBA/2J, BXD5 BXD12, BXD34, BXD40, BXD48a, BXD60, BXD69, BXD100, BXD101, and BXD102) and the eightfold higher
levels of expression in other strains (BXD16, BXD31, BXD42, BXD43, BXD50, BXD56, BXD75, and BXD85). Most of the high expressing
strains were isolated at 2 h after light on and the low expressing strains had retinas isolated at least 4 h after light on.
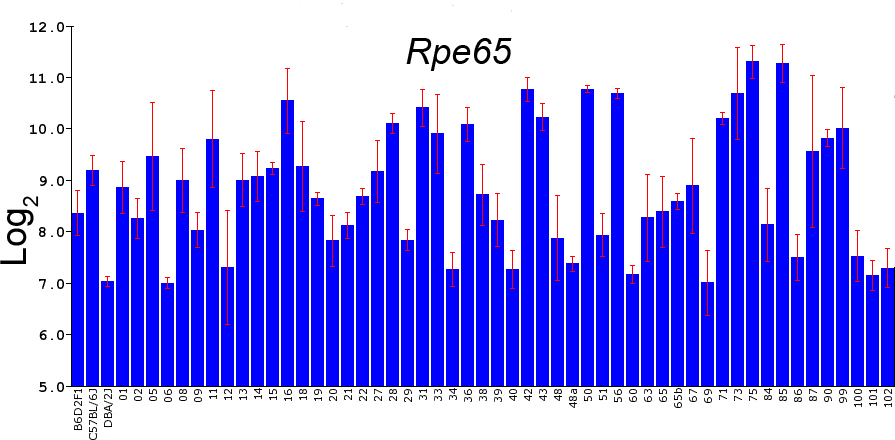
 Figure 1 of
King, Mol Vis 2015; 21:1235-1251.
Figure 1 of
King, Mol Vis 2015; 21:1235-1251.