Figure 2 of
Chaiyasan, Mol Vis 2015; 21:1224-1234.
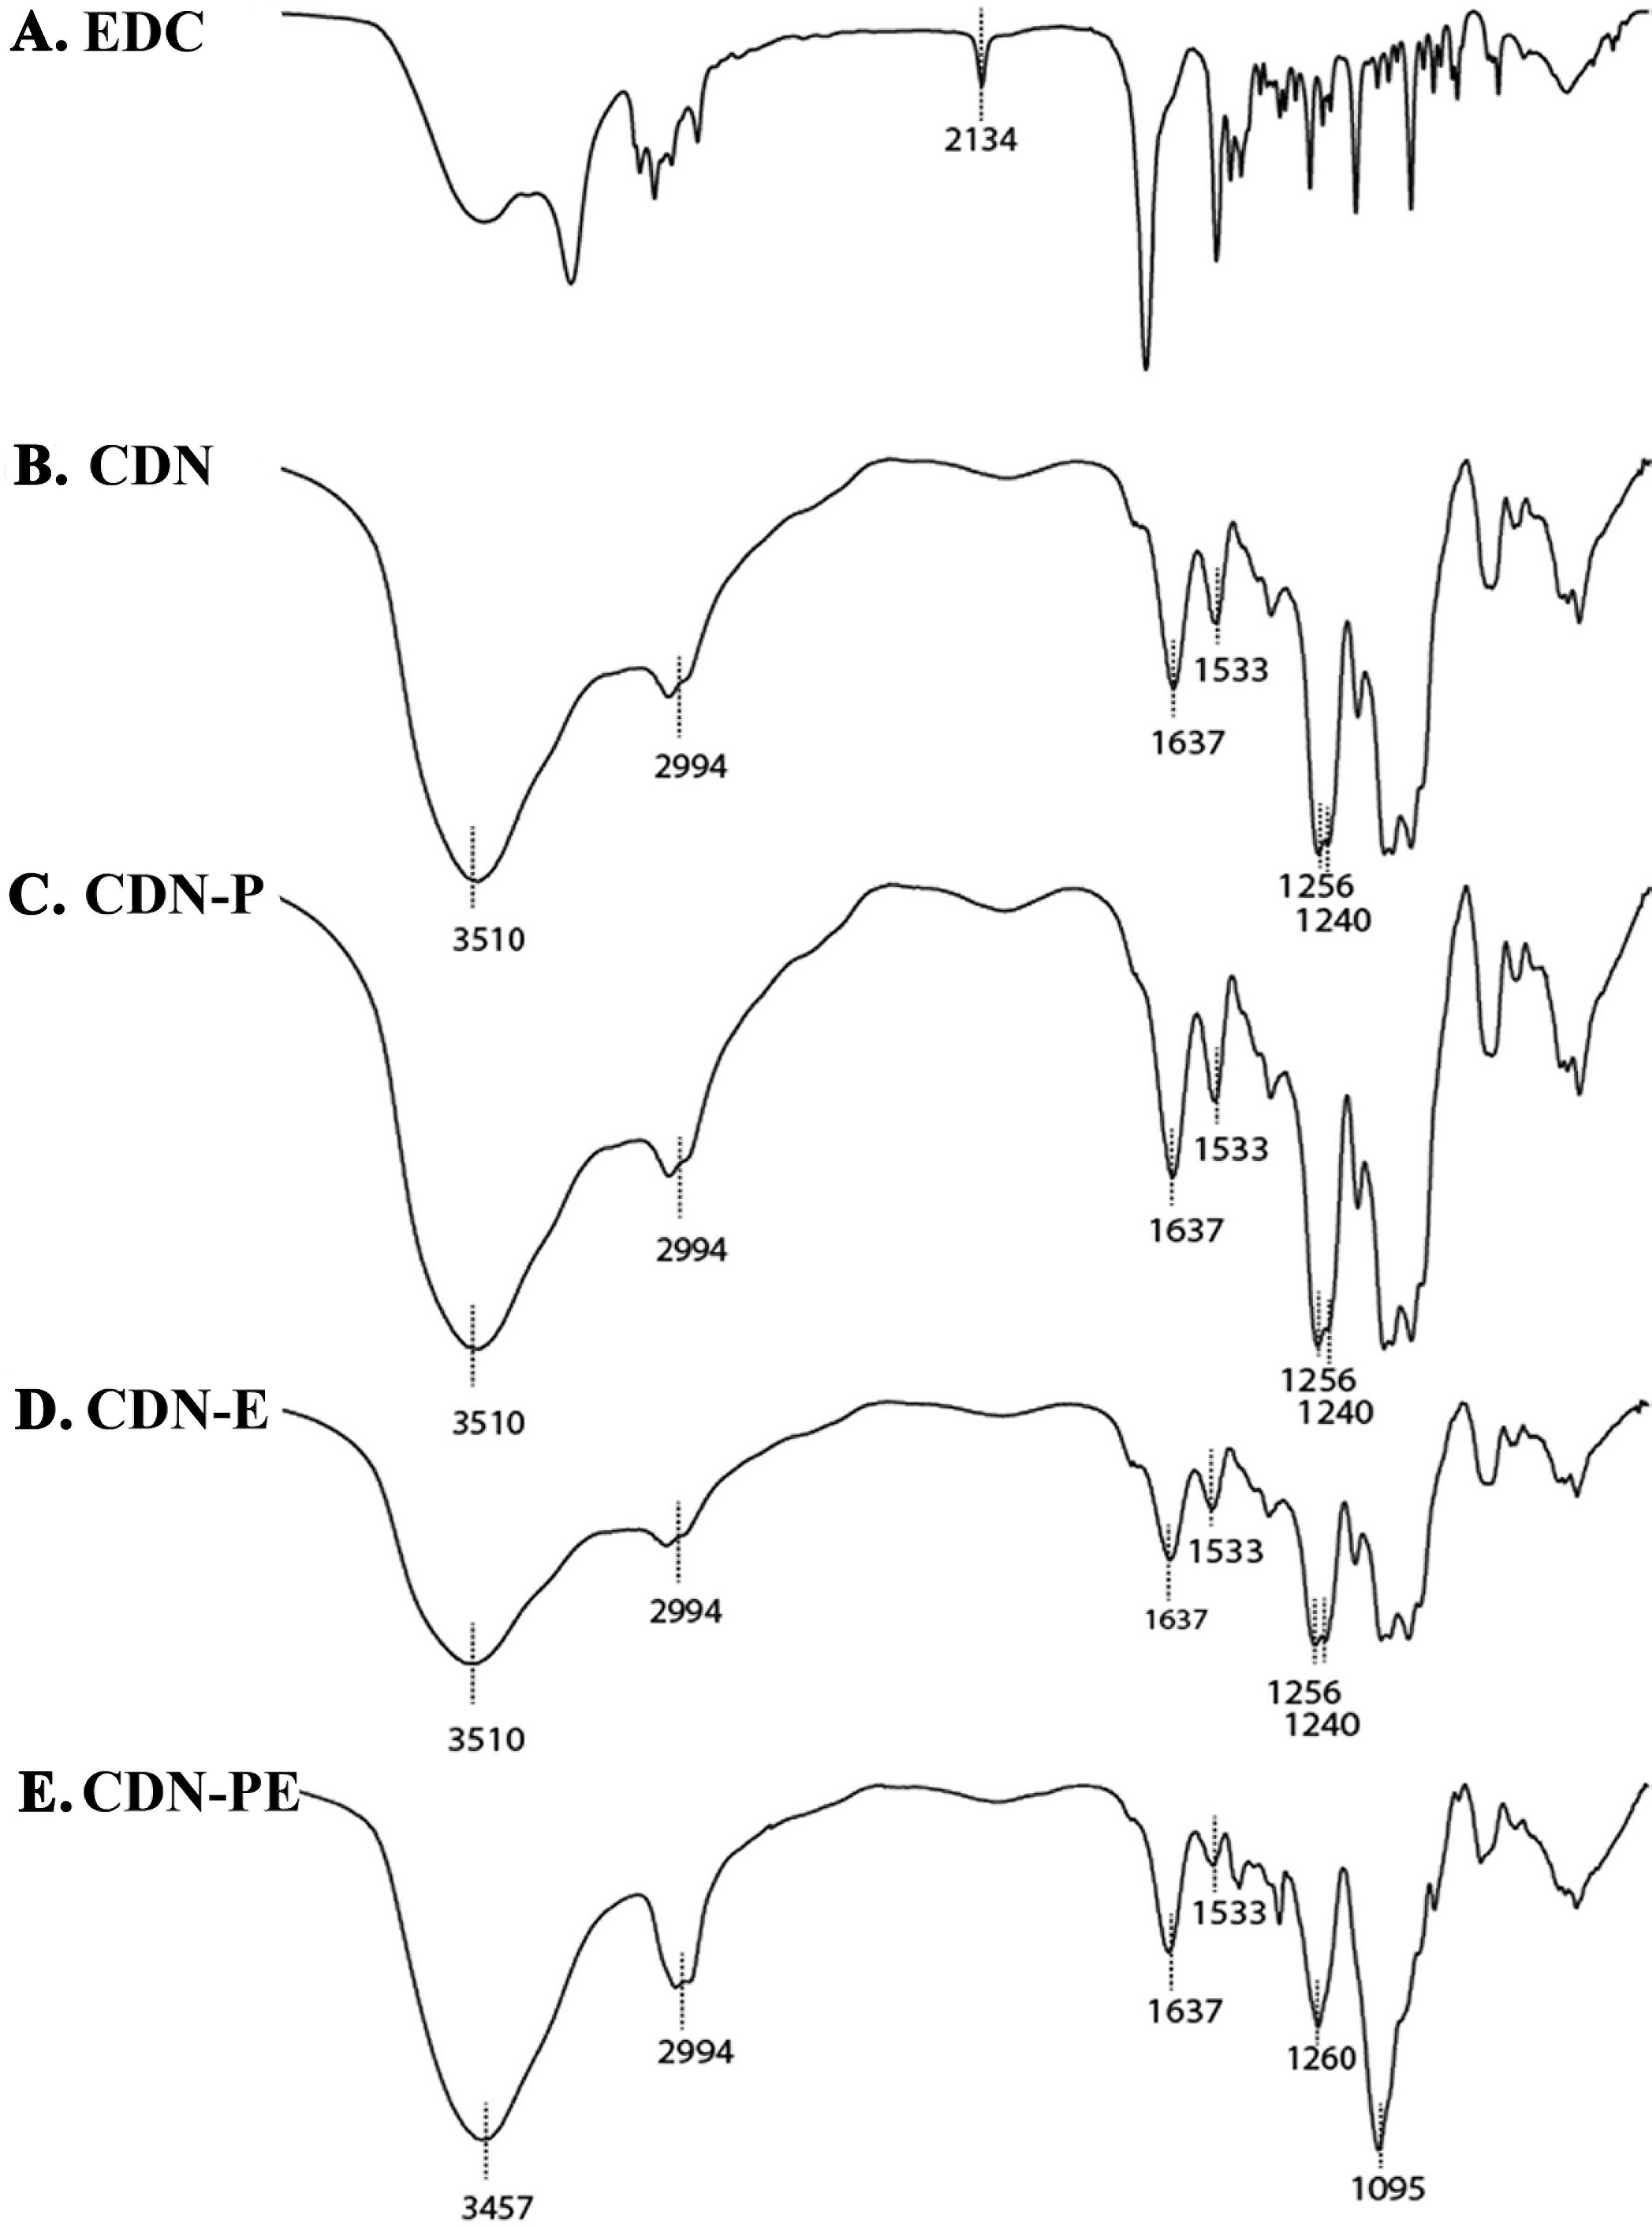
Figure 2.
Characterization of CDN formulations by Fourier transform infrared spectroscopy. FTIR spectra are shown for are EDC powder (
A
), CDN (
B
), CDN-P (
C
), CDN-E (
D
), and CDN-PE (
E
). A KBr disc was used for holding the samples.
 Figure 2 of
Chaiyasan, Mol Vis 2015; 21:1224-1234.
Figure 2 of
Chaiyasan, Mol Vis 2015; 21:1224-1234.