Figure 2. The collagen gene expression is attenuated in the KC corneal epithelium. The relative gene expression values for COL IA1 and
COL IVA1 were measured from 52 control and 90 KC corneal epithelium samples. The relative gene expression of (A) COL IA1 and COL IVA1 in the control versus KC; (B) COL IA1 and COL IVA1 mRNA levels stratified by clinical grades of KC. C: A linear regression analysis of the relative gene expression levels of LOX (y-axis) and COL IA1 (x-axis). Each circle represents
an individual eye. D: A linear regression analysis of the relative gene expression levels of LOX (y-axis) and COL IVA1 (x-axis). Each circle represents
individual eyes. E: A linear regression analysis of the relative gene expression levels of COLI A1 (y-axis) and COL IVA1 (x-axis). Each circle
represents an individual eye.
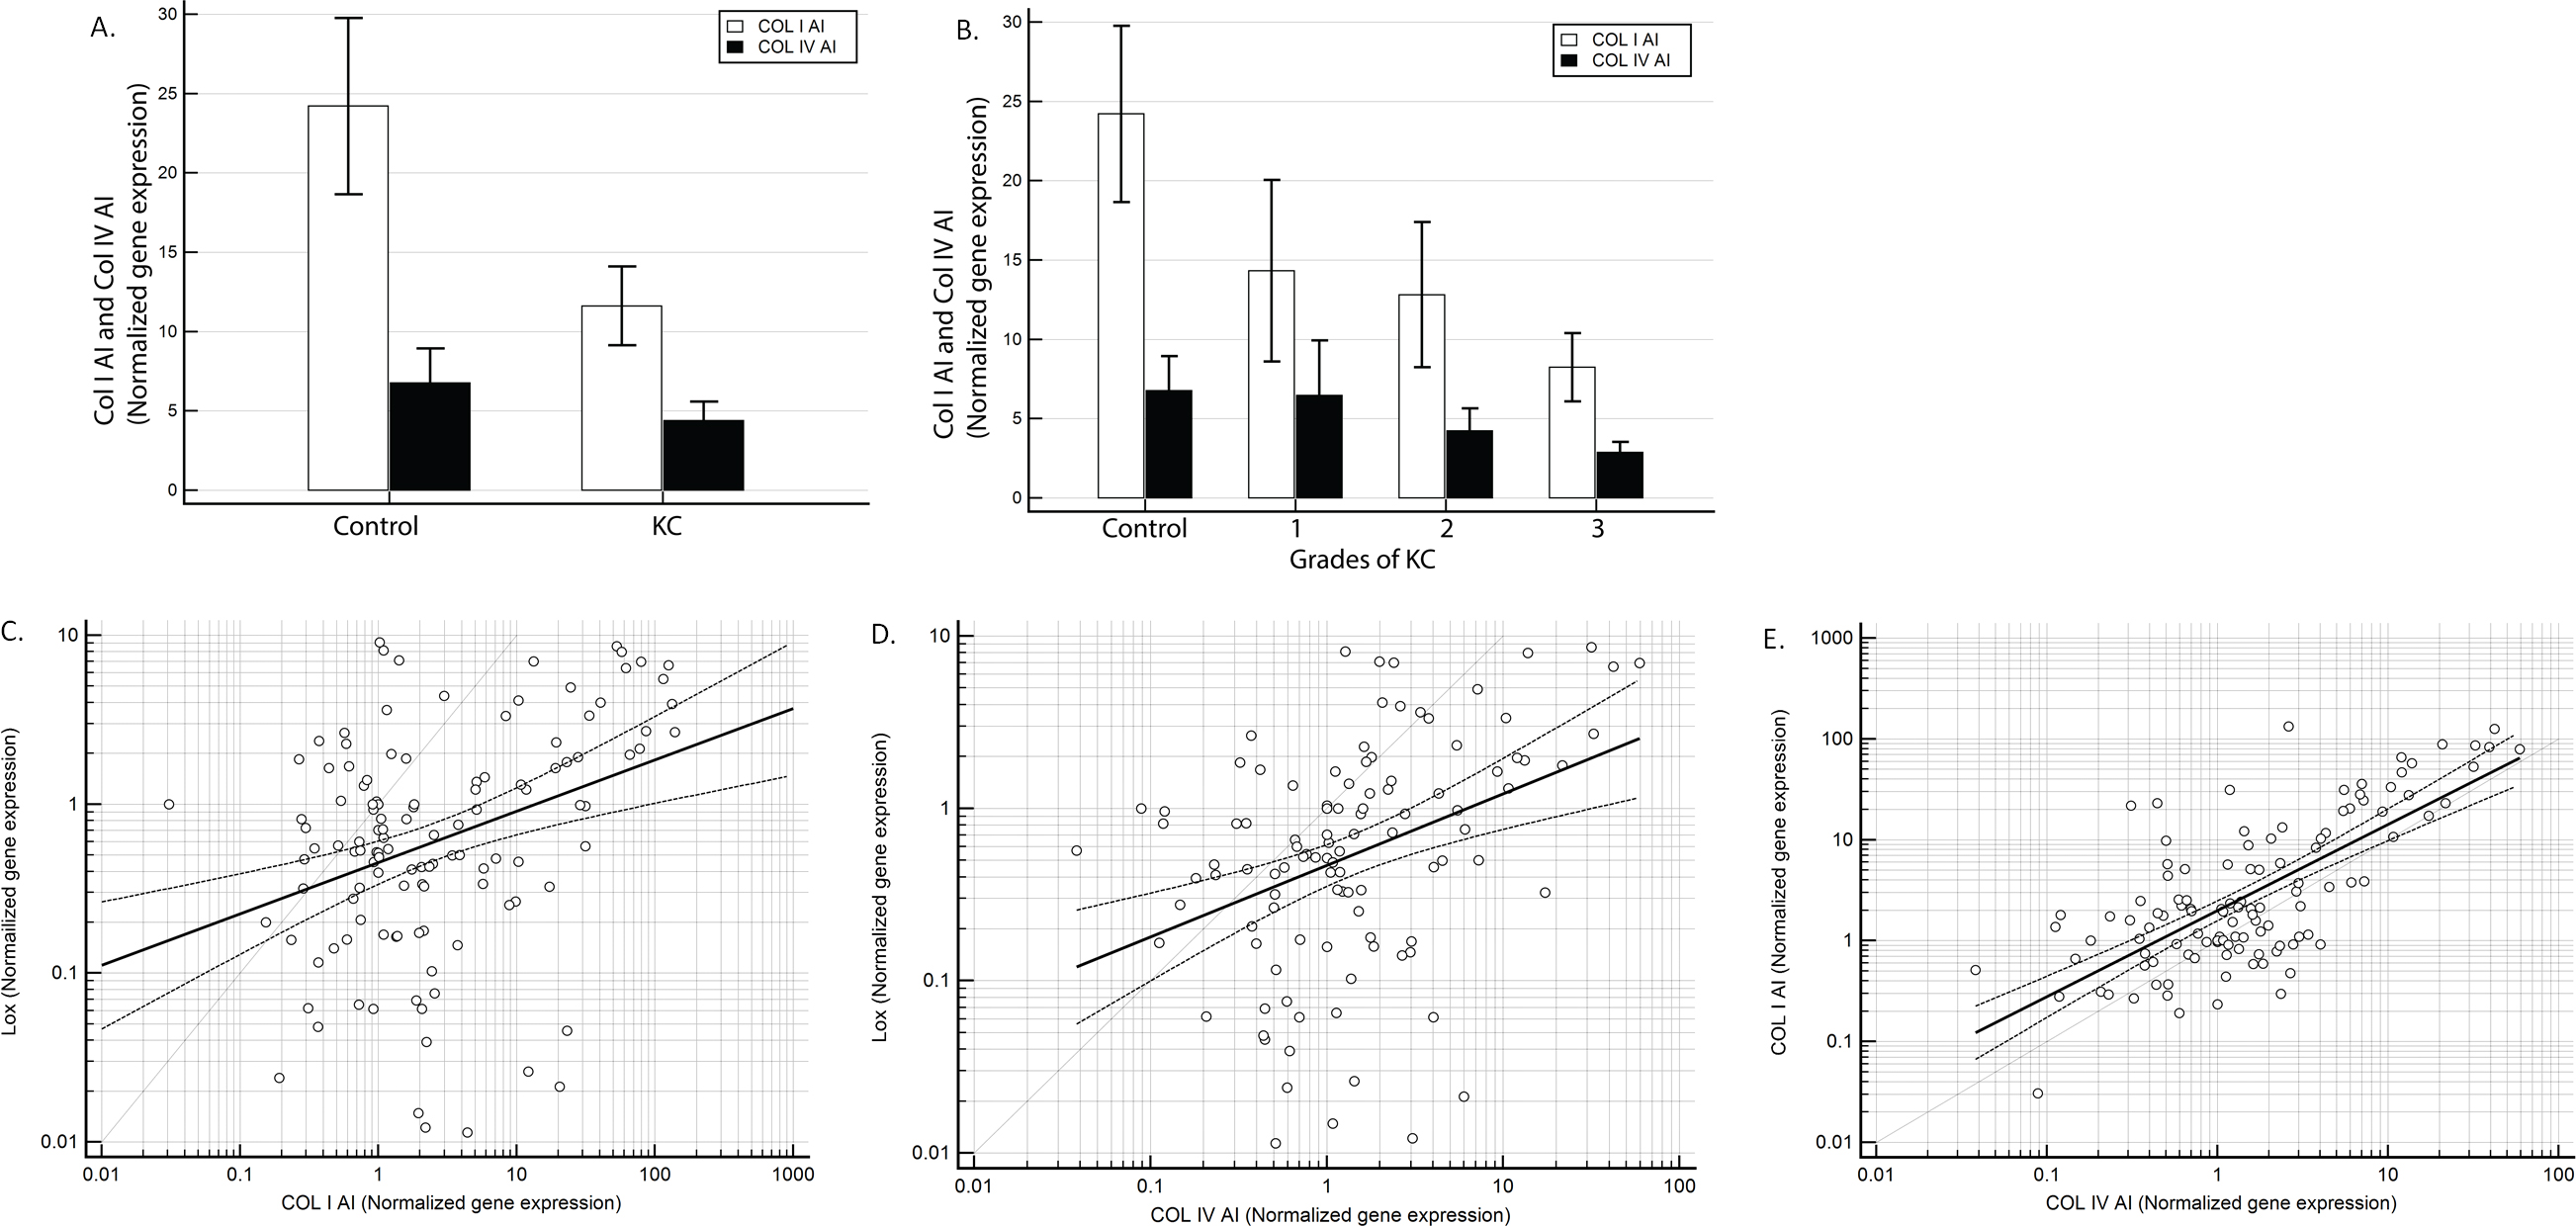
 Figure 2 of
Shetty, Mol Vis 2015; 21:12-25.
Figure 2 of
Shetty, Mol Vis 2015; 21:12-25.