Figure 4. Effects of anti-miR-155 on retinal neovascularization in the laser-induced CNV model. Angiographic analysis of CNV leakage
14 days after laser photocoagulation in the various treatment groups and the control group. Panels A and B show representative images of retina FFA in various treatment groups and the results of statistical analysis. Panels B and C depict representative confocal images of the anti-ctrl and anti-miR-155 groups and the results of statistical analysis. Panels
E and F are representative images of HE-stained sagittal sections of the anti-ctrl and anti-miR-155 groups and the results
of statistical analysis. The data are presented as mean ± SD. *p<0.05, **p<0.01, ***p<0.001. Scale bar: 100 μm.
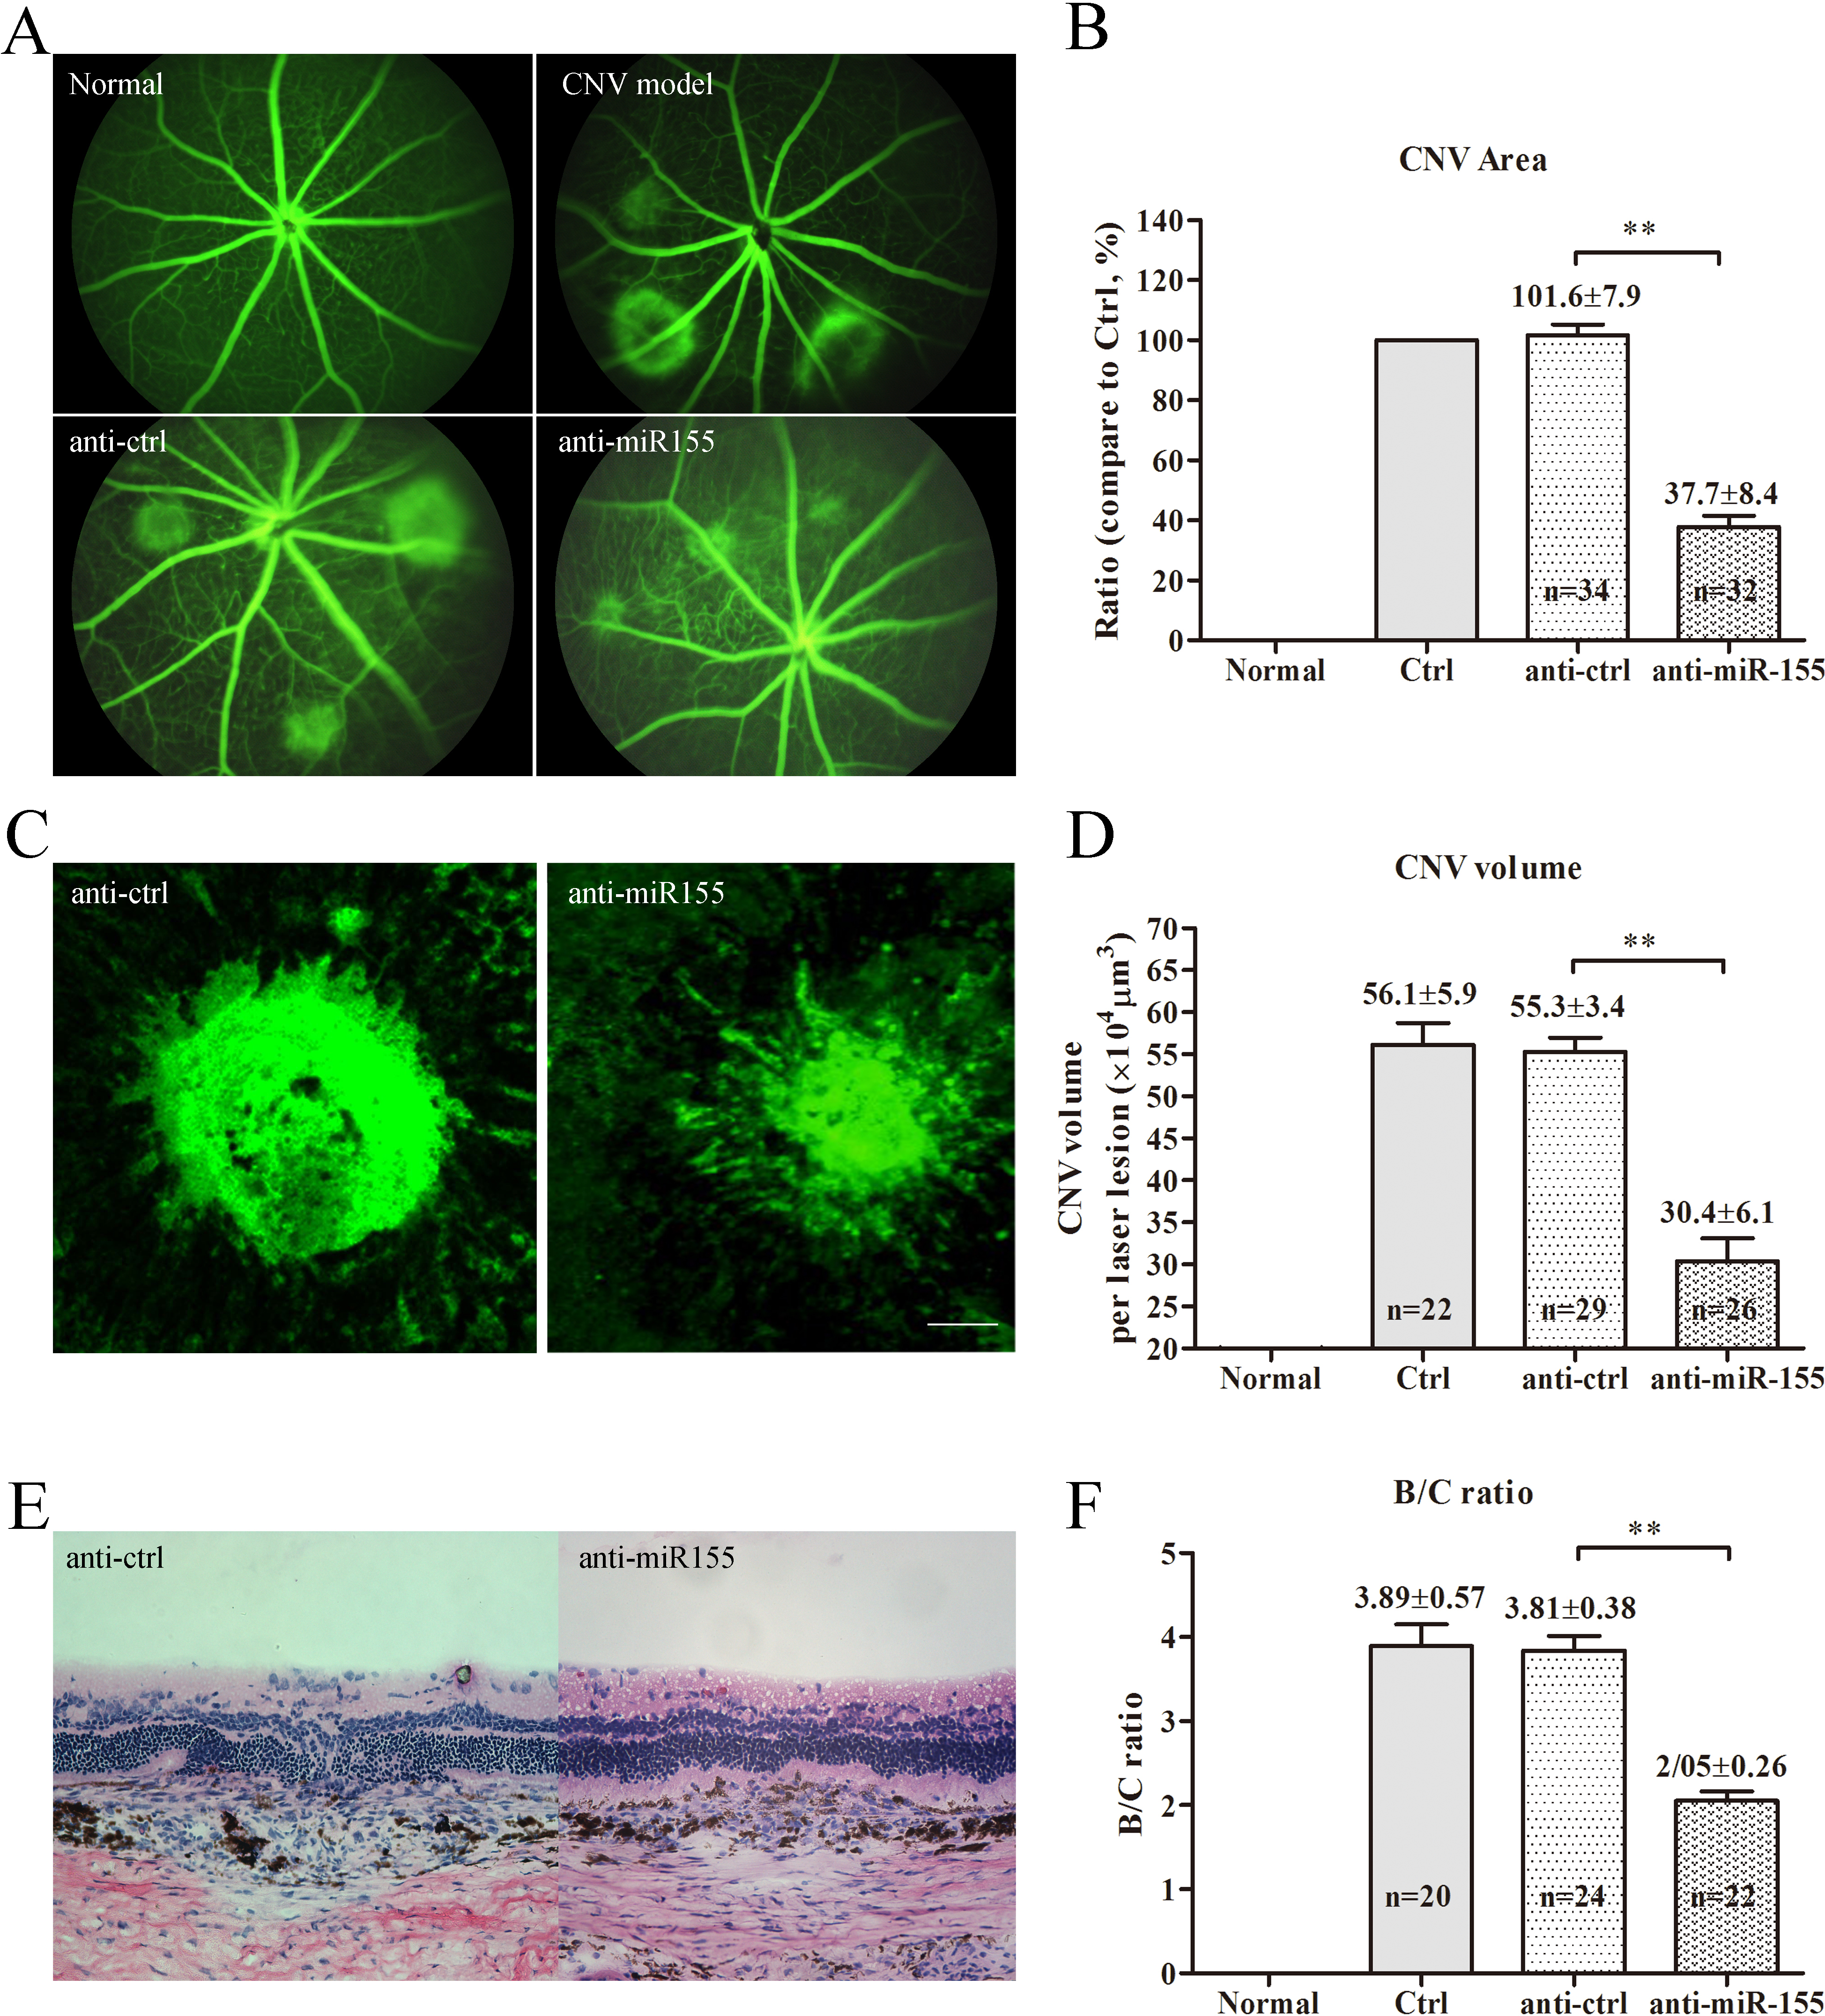
 Figure 4 of
Zhuang, Mol Vis 2015; 21:1173-1184.
Figure 4 of
Zhuang, Mol Vis 2015; 21:1173-1184.