Figure 2. Five-parameter logistic curve of DA-Bead. Curves from experiment 2 are presented in this figure. The blue dotted line represents
the lower limit of quantitation (LLOQ) and the upper limit of quantitation (ULOQ) calculated with Bio-Plex Manager software.
FitProb and ResVar are the fitting probability and the residual variance, respectively, calculated by Bio-Plex Manager software
for the indicated curve. The concentration and the median fluorescence intensity (MFI) scale are in the log range.
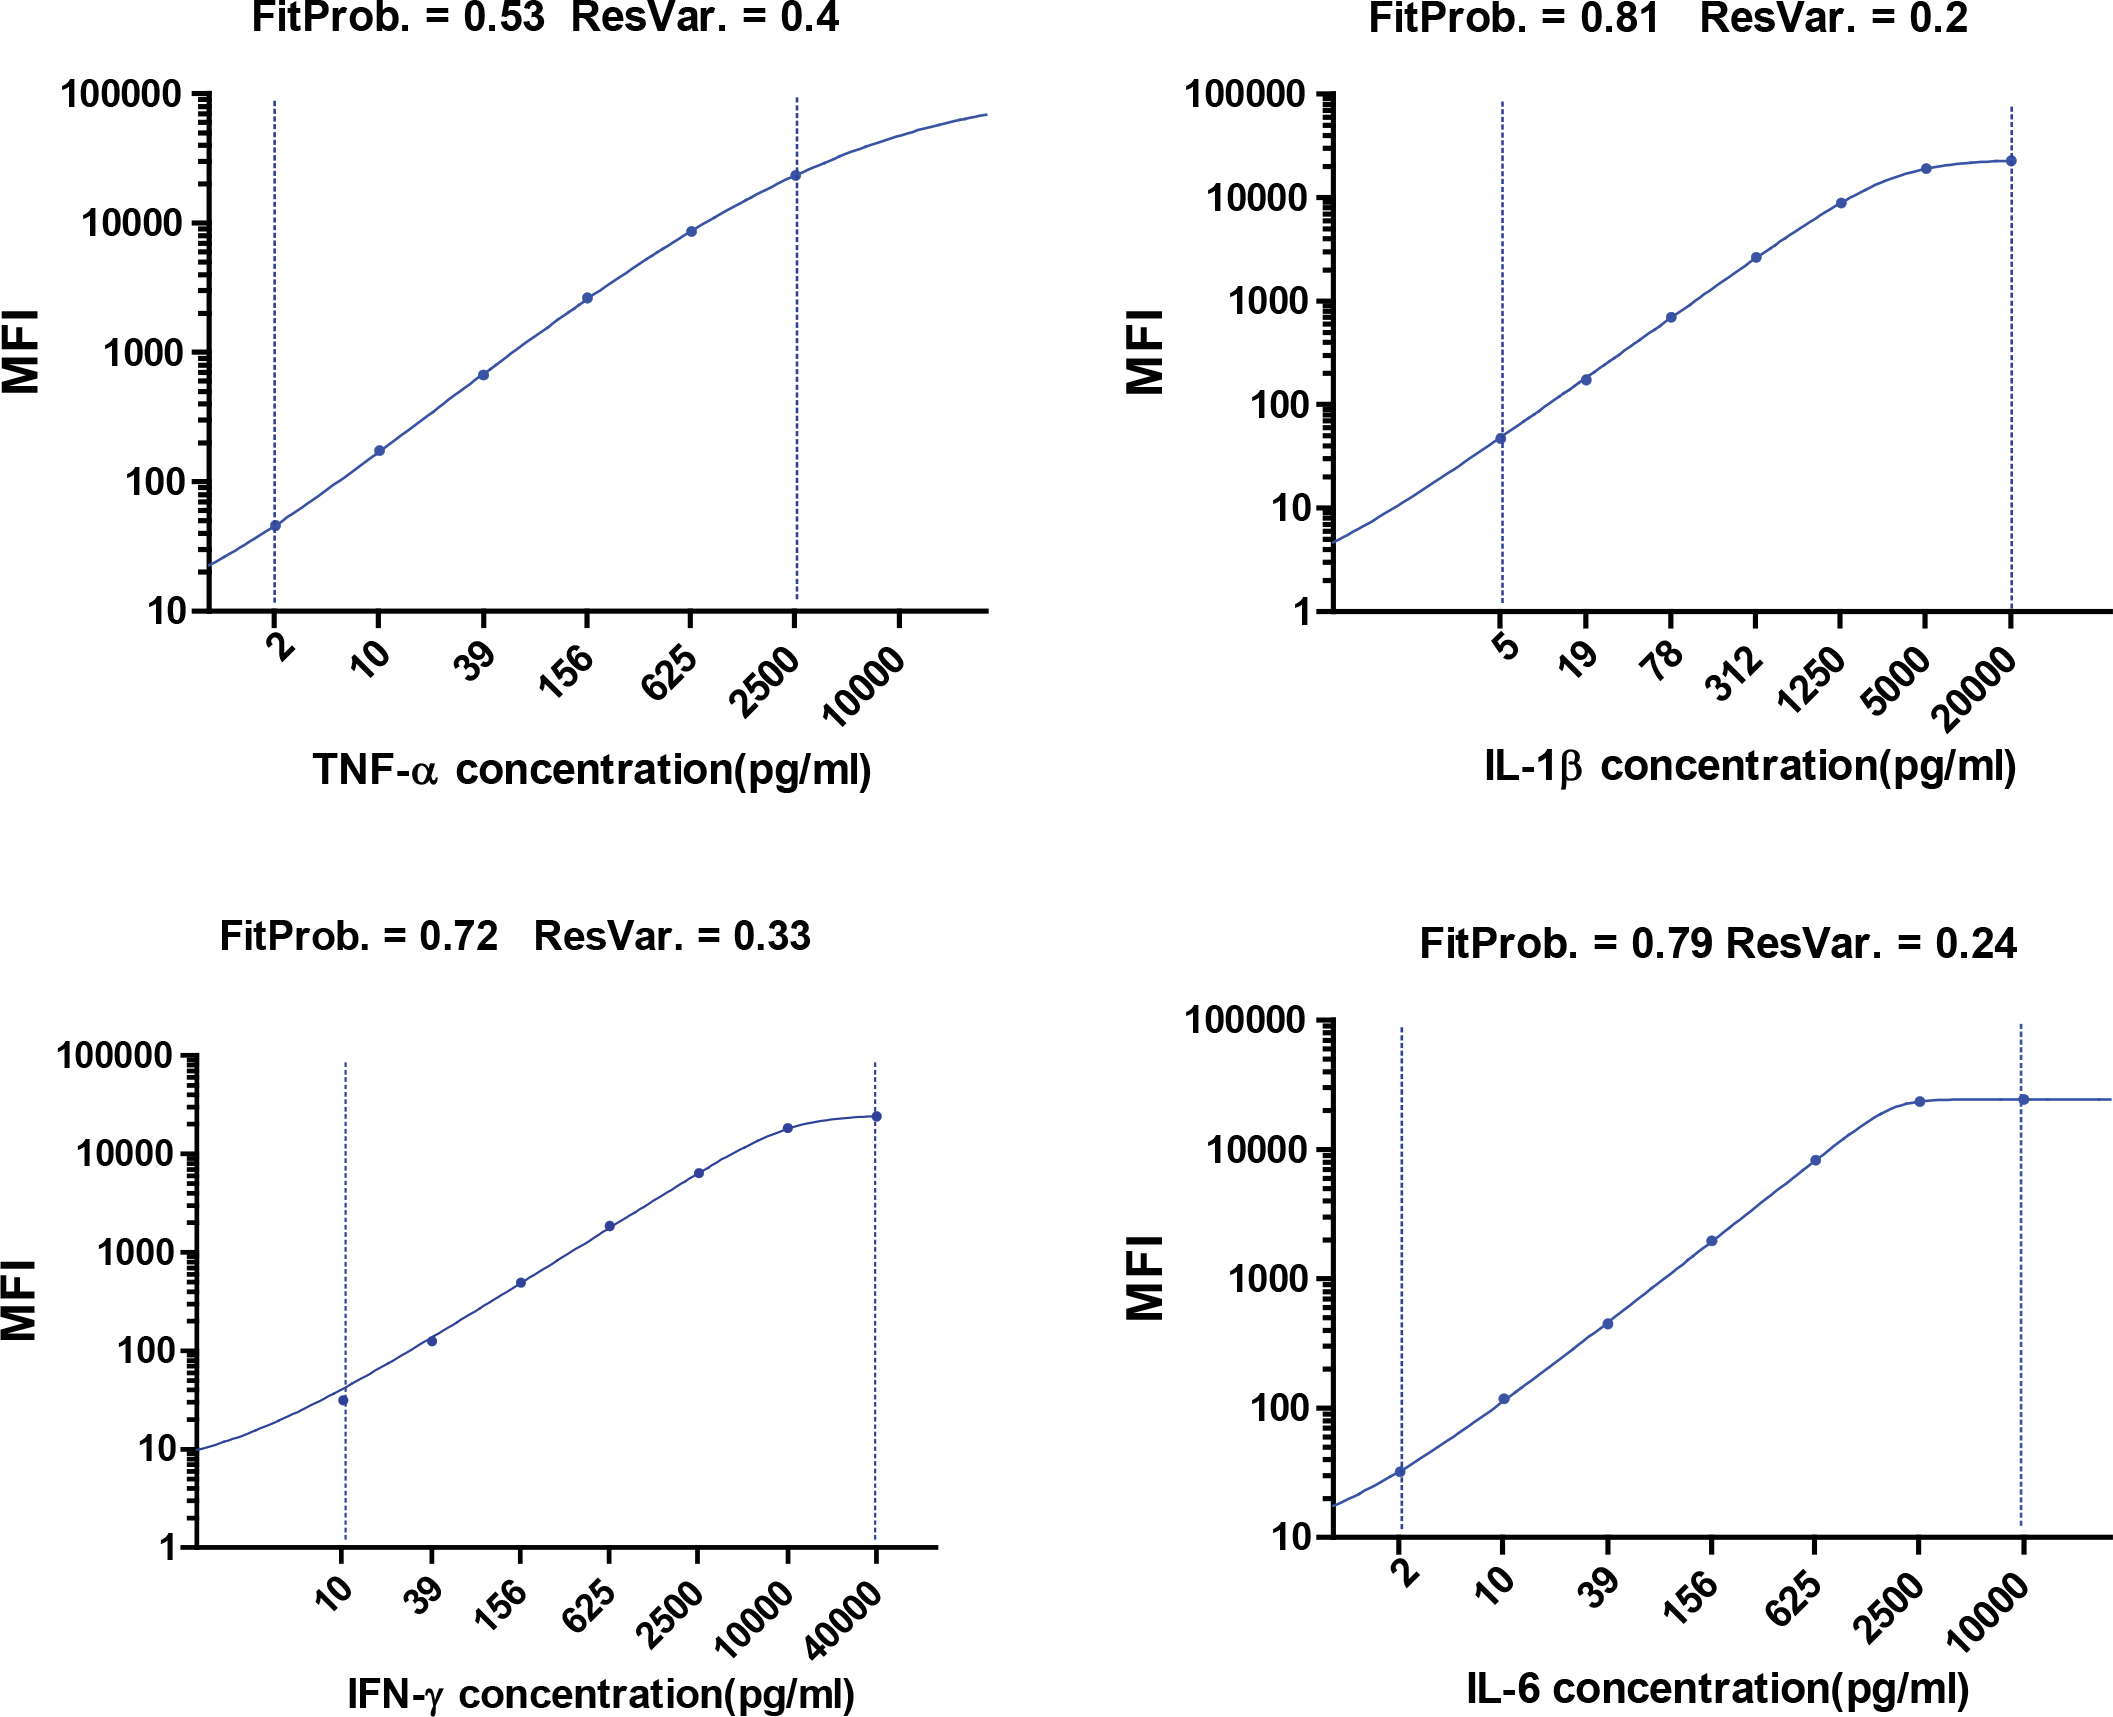
 Figure 2 of
Le Guezennec, Mol Vis 2015; 21:1151-1161.
Figure 2 of
Le Guezennec, Mol Vis 2015; 21:1151-1161.