Figure 2. C5a induces changes in the expression level of TLR4. A and B: Time- (A) and dose-dependent (B) regulation of the TLR4 mRNA expression. ARPE-19 cells were stimulated with C5a (50 ng/ml) for 40, 80, 100, and 120 min,
or they were stimulated with different concentrations of C5a (25, 50, and 100 ng/ml) for 80 min. C, D, E, and F: Flow cytometric analysis of the TLR4 protein expression. Cells were stimulated with C5a (50 ng/ml) or LPS (100 ng/ml) for
80 min. The data are expressed as the mean±SD of three independent experiments. Statistical analysis was performed using a
one-way ANOVA (* indicates p<0.05 and ** indicates p<0.01).
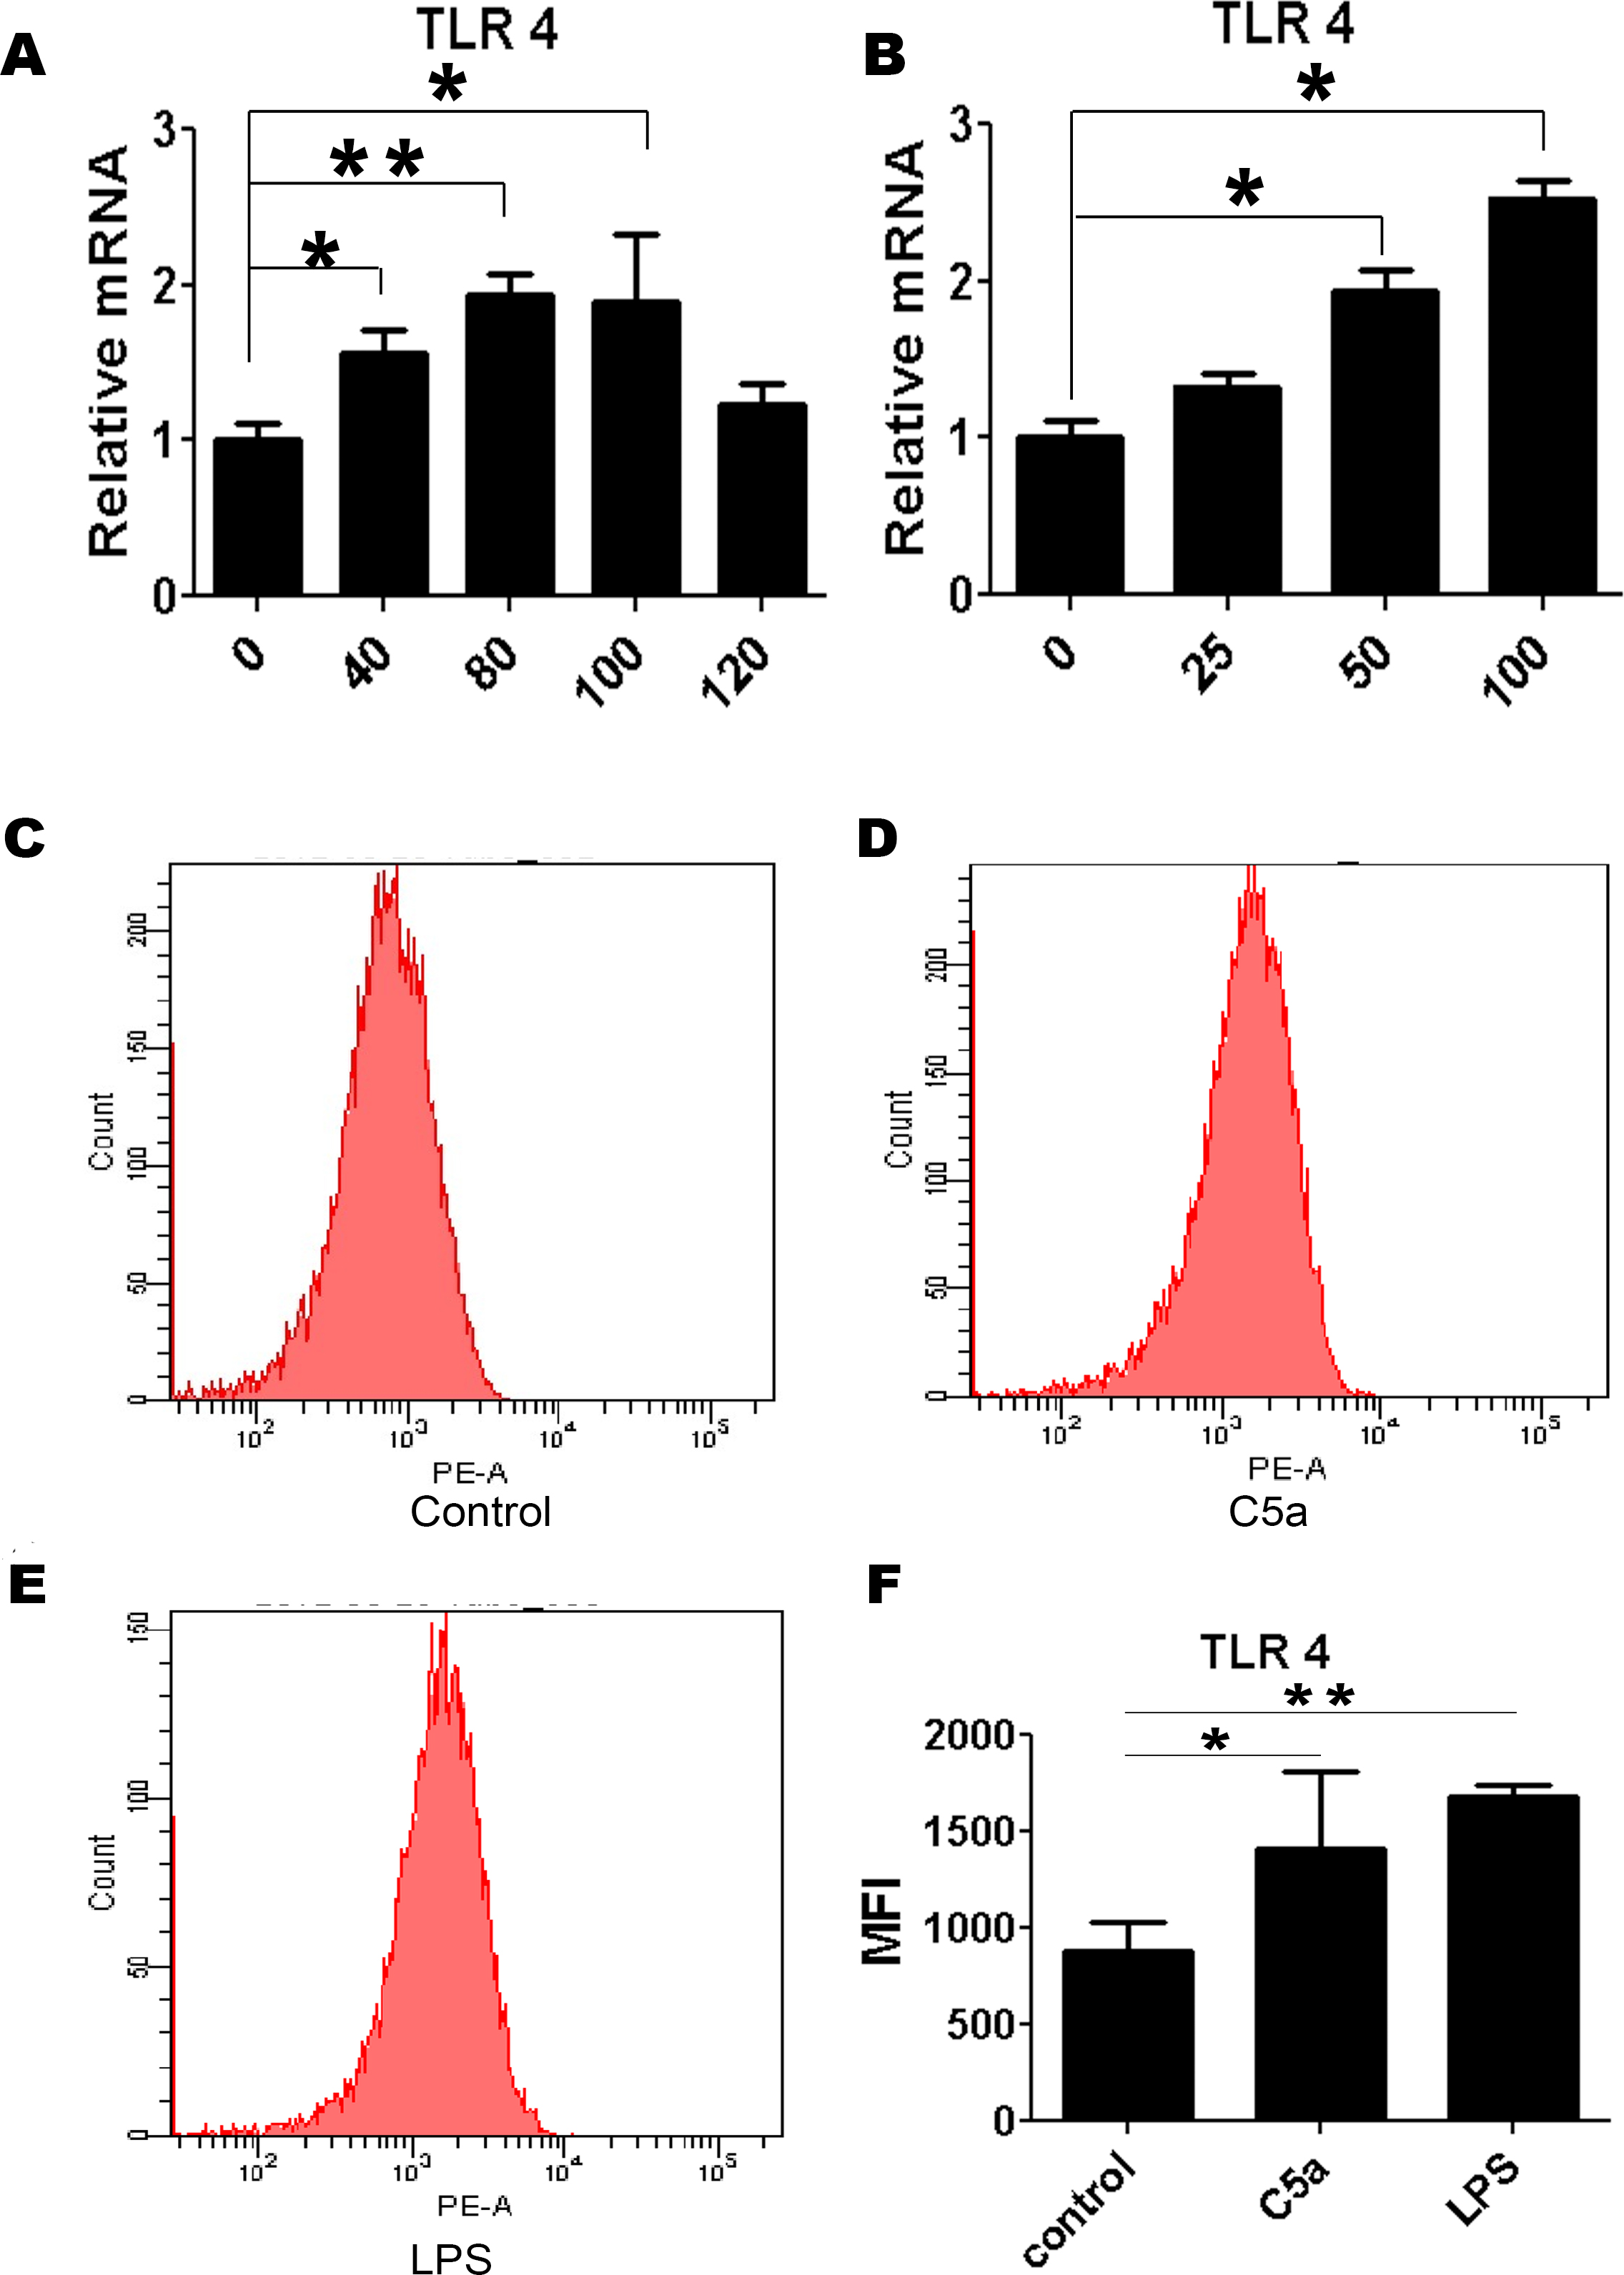
 Figure 2 of
Zhu, Mol Vis 2015; 21:1122-1129.
Figure 2 of
Zhu, Mol Vis 2015; 21:1122-1129.