Figure 3. Relationship between plasma fibrinogen and TBARS levels in the different samples. The figure shows a positive correlation
(adjusted r2=0.17) between the plasma fibrinogen and thiobarbituric acid-reactive substances (TBARS) levels in the vitreous.
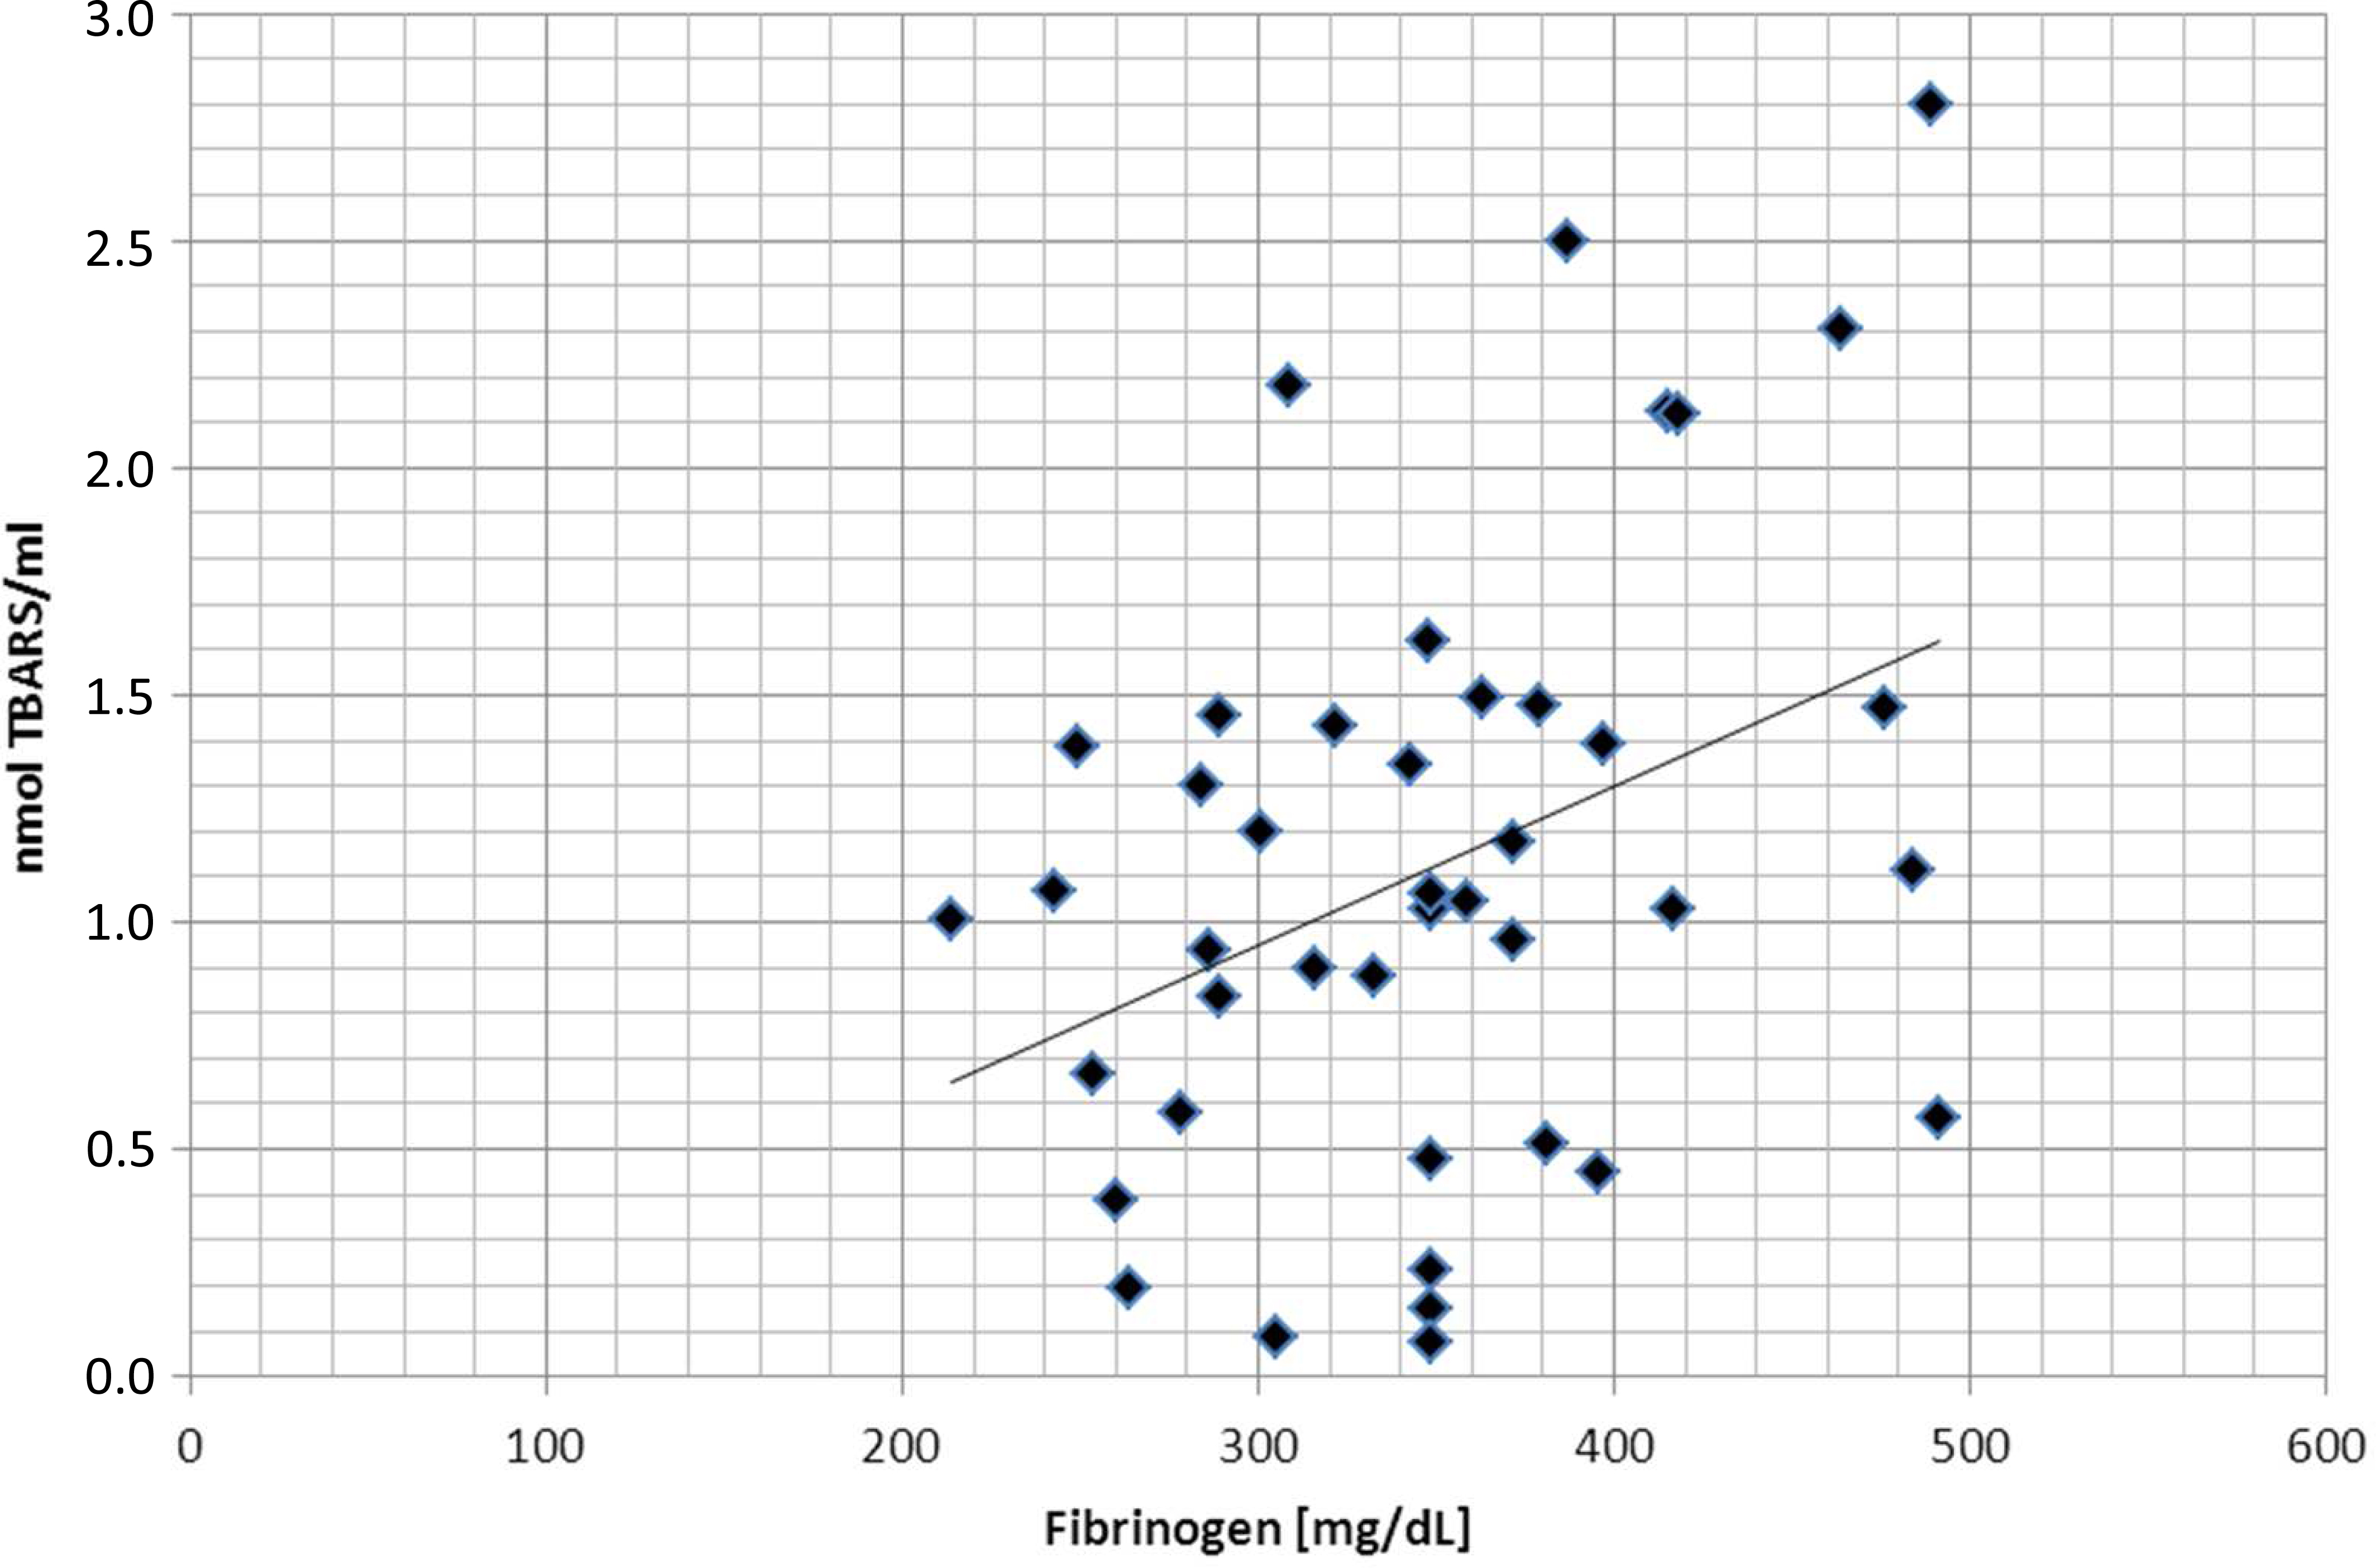
 Figure 3 of
Nuzzi, Mol Vis 2015; 21:1106-1112.
Figure 3 of
Nuzzi, Mol Vis 2015; 21:1106-1112.