Figure 3. qPCR data for Cfh and Cfhr2 from the mouse RPE/choroid. Quantitative real-time PCR (qPCR) results are shown for RPE/choroid
samples (n=6) from C57BL/6 mice for Cfh and Cfhr2 (A). Results for 129/Sv Cfh−/− mice along with their wild-type background strain (129/Sv) are shown for Cfh (B) and Cfhr2 (C). Note that the Cfh message was still detected in the Cfh−/− mice, but at a low level. (*) denotes significant difference (p<0.05).
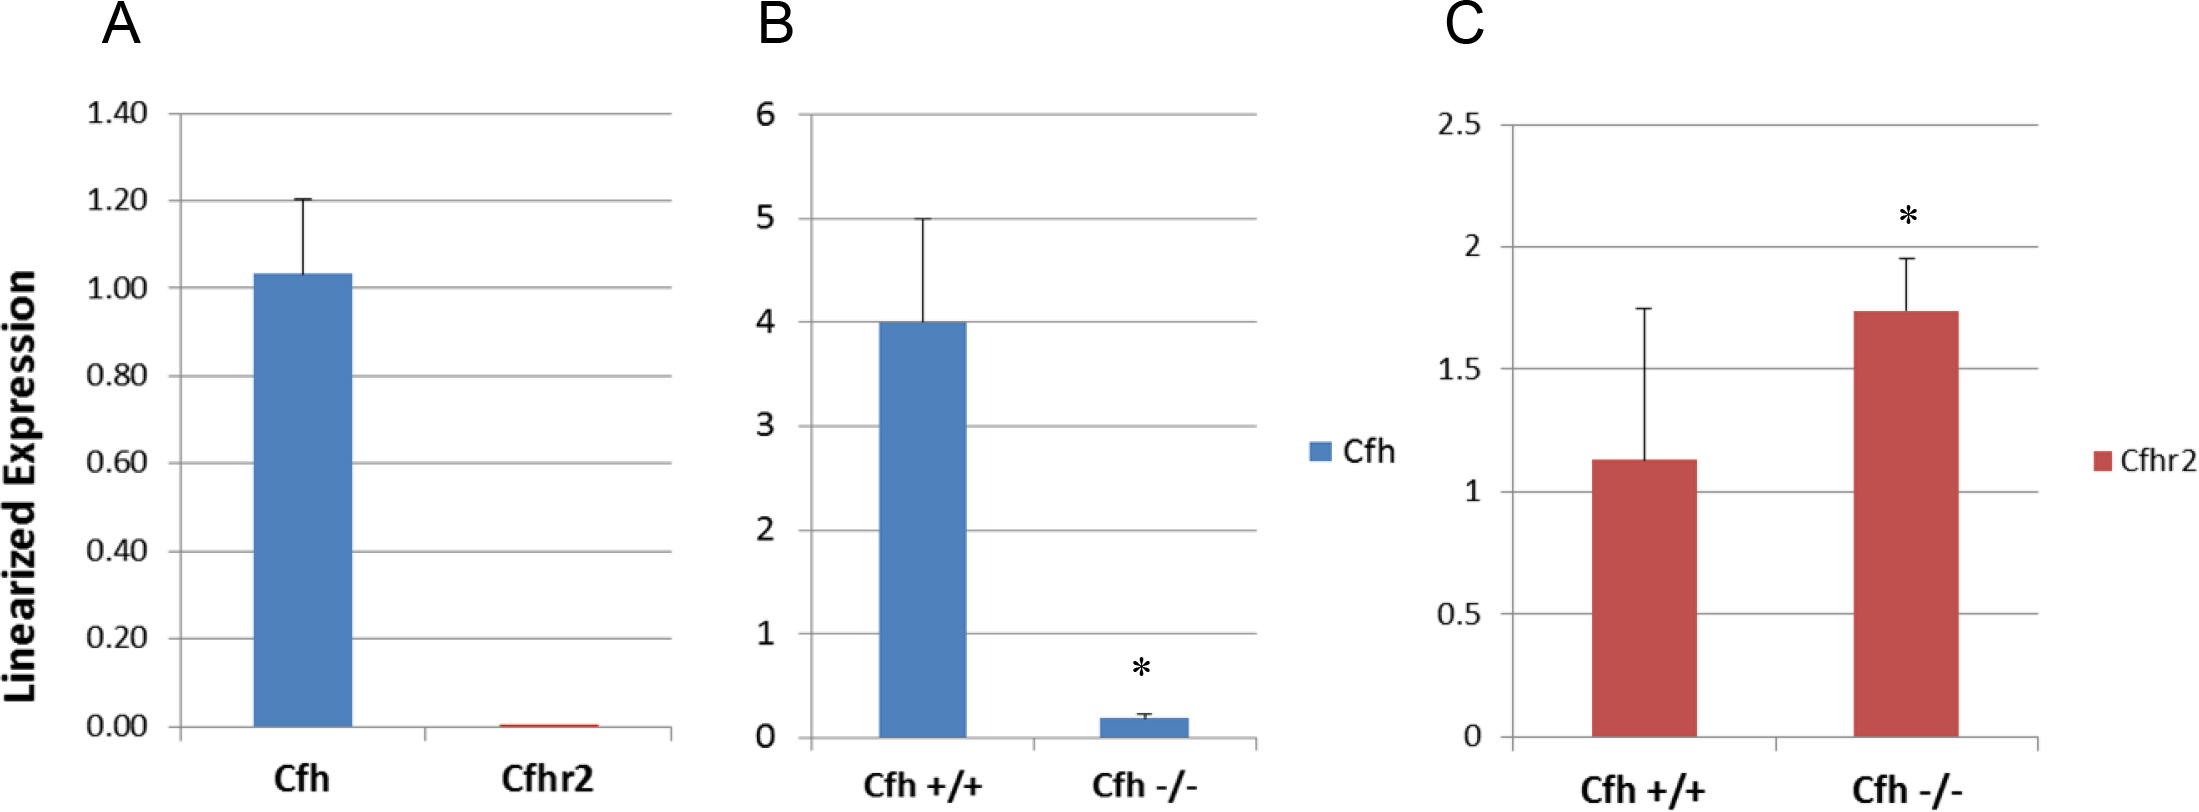
 Figure 3 of
Smit-McBride, Mol Vis 2015; 21:110-123.
Figure 3 of
Smit-McBride, Mol Vis 2015; 21:110-123.