Figure 4. Pedigree of proband 2 and CNV analysis of PIKFYVE using qPCR. A: Proband 2 is designated with an arrowhead and the filled symbol represents the affected status of the individual. B: The CNV ratios were calculated between proband 2 and the unaffected control. PIKFYVE exons 15 and 16 demonstrated mean (minimum of 3 technical replicates) CNV ratios of approximately 0.5, which is evidence
of a hemizygous deletion including these two exons. Error bars represent standard error of the mean.
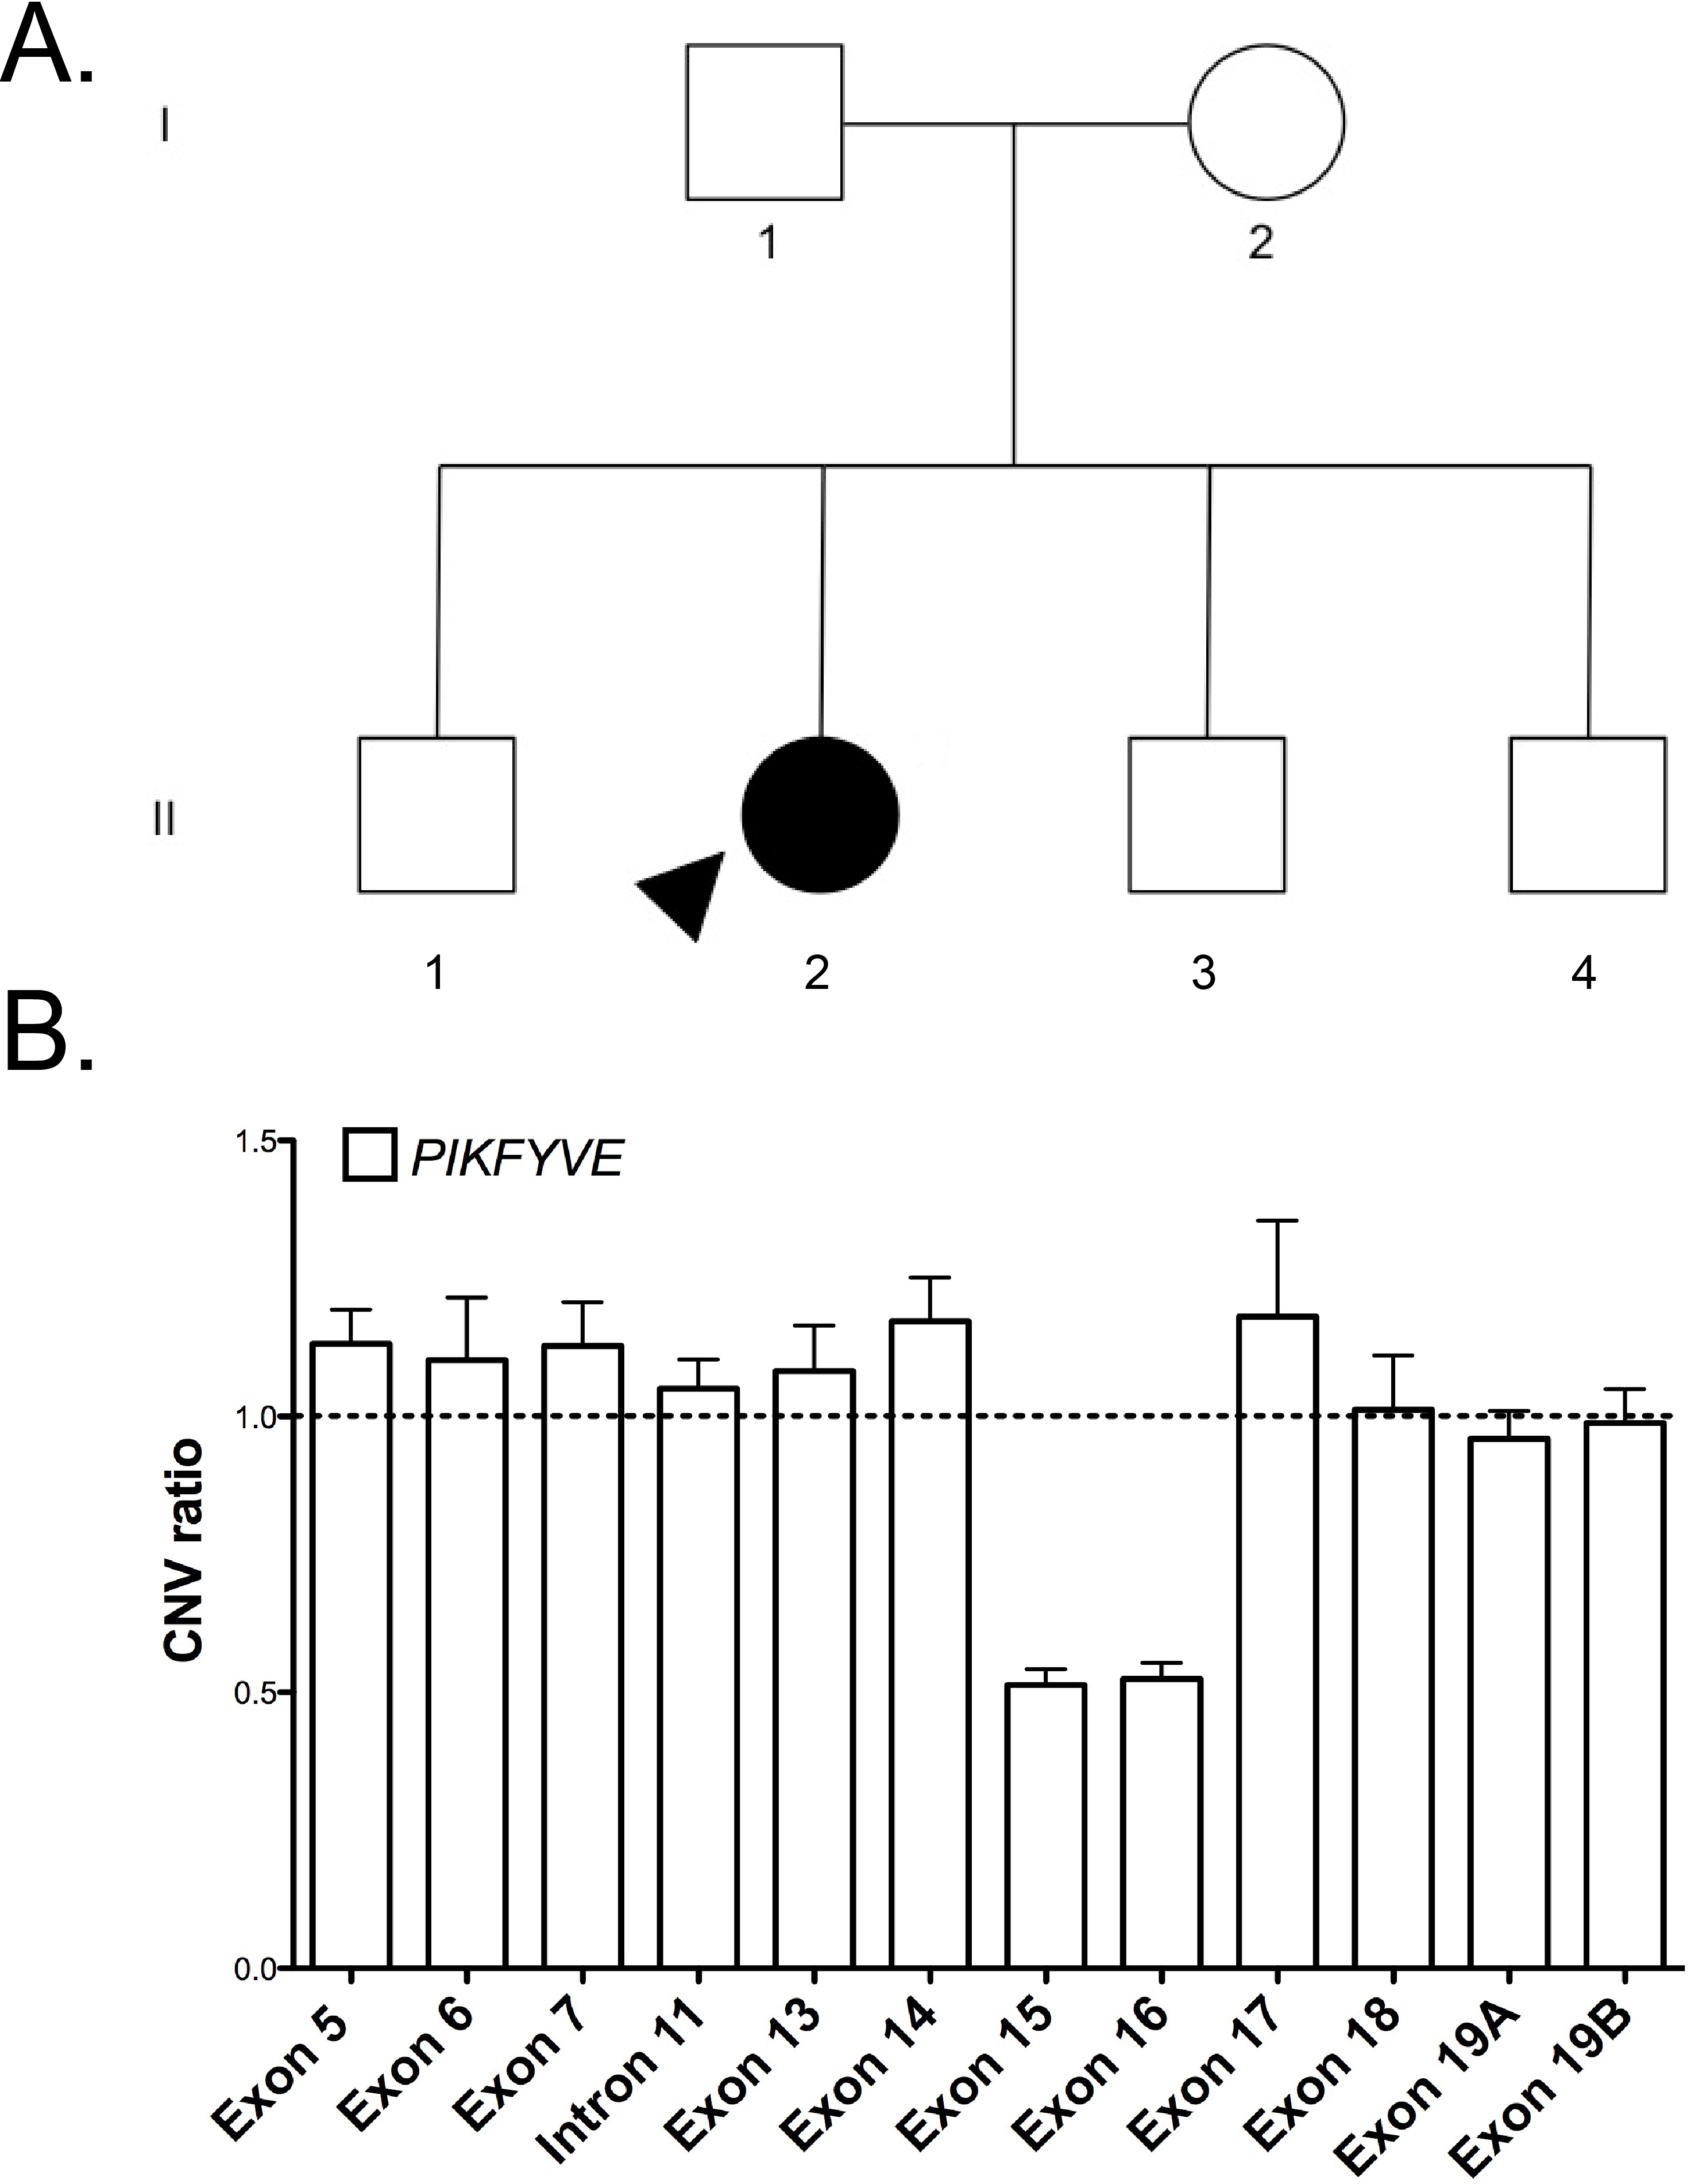
 Figure 4 of
Gee, Mol Vis 2015; 21:1093-1100.
Figure 4 of
Gee, Mol Vis 2015; 21:1093-1100.