Figure 6 of
Itakura, Mol Vis 2015; 21:1071-1084.
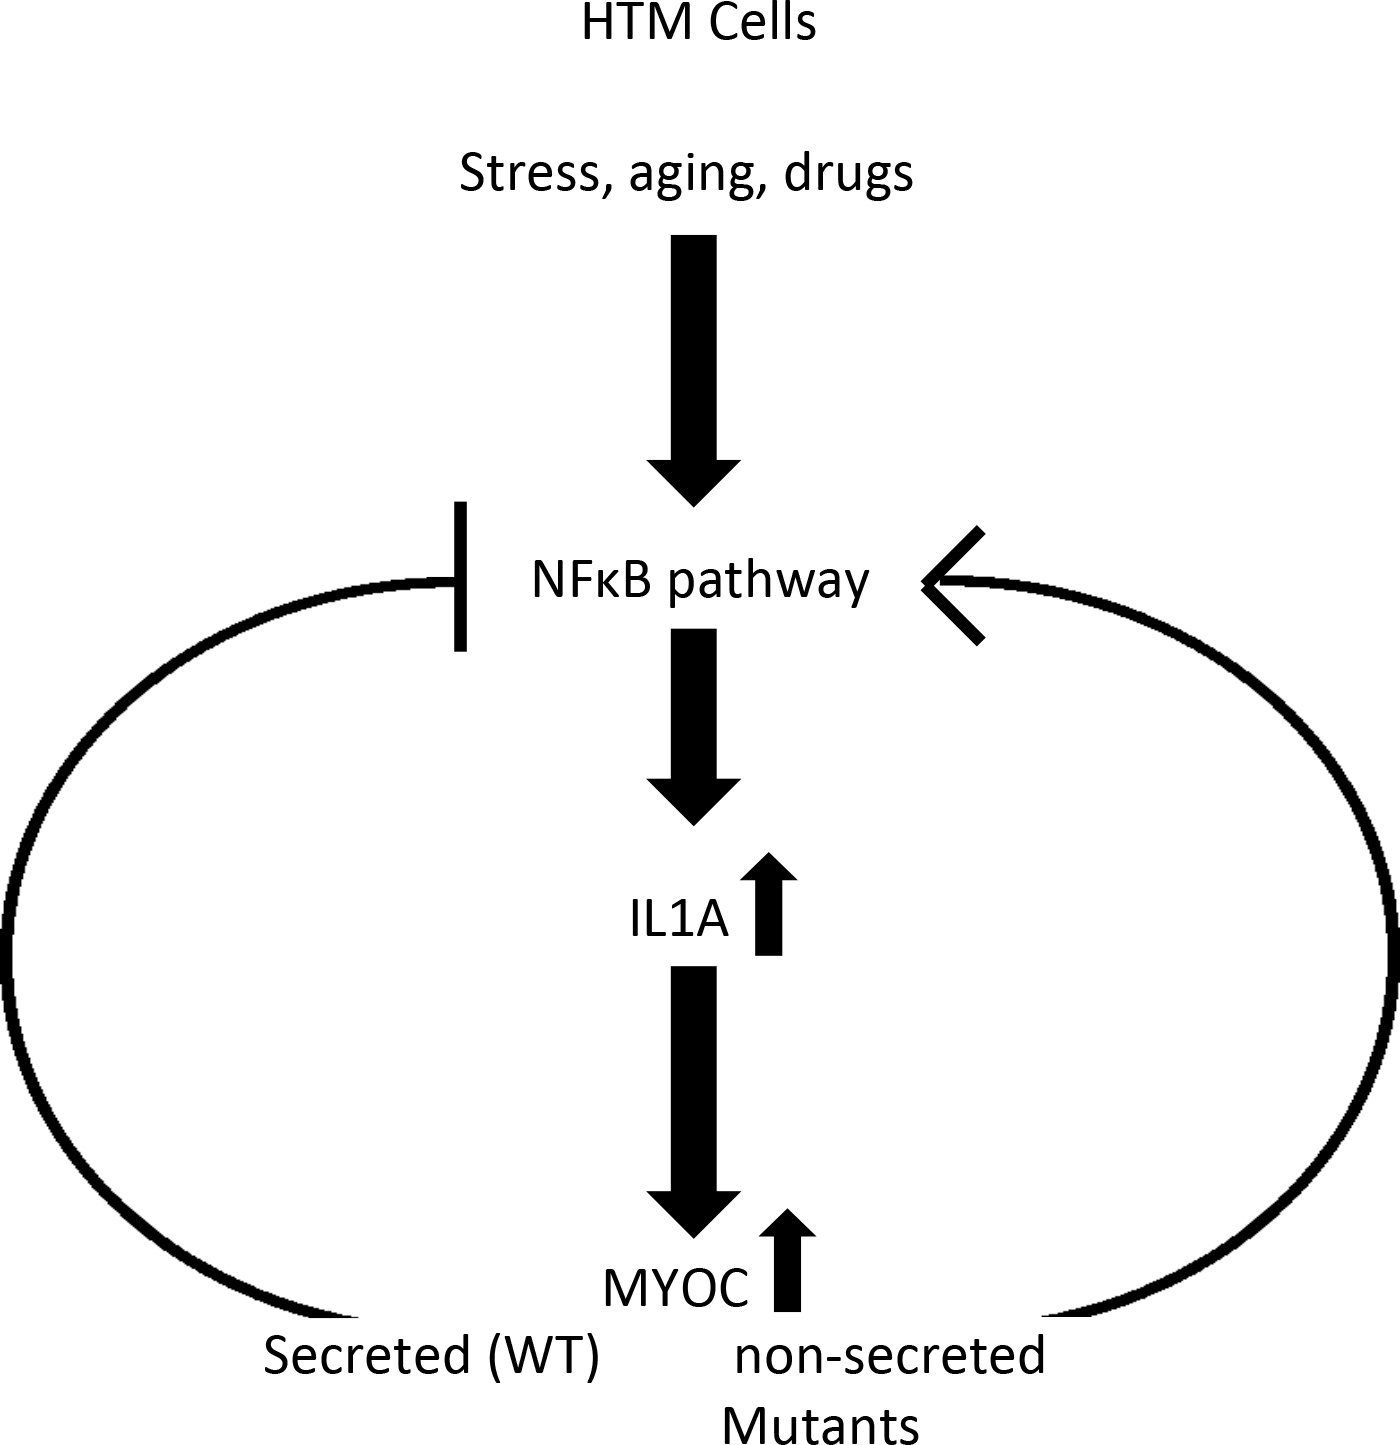
Figure 6.
Schematic Representation A model is depicted illustrating the possible positive (retained MYOC mutants) and negative (WT MYOC) feedback loops controlling the IL1A/NFkappaB pathway in TBM cells.
 Figure 6 of
Itakura, Mol Vis 2015; 21:1071-1084.
Figure 6 of
Itakura, Mol Vis 2015; 21:1071-1084.