Figure 3. Correlation between electroretinogram recordings, ATP and vesicular nucleotide transporter expression. Relationship between
ERG amplitude and ATP levels (A) and ERG amplitude and VNUT expression (B). Correlation was performed in glaucomatous animals comparing 3 versus 15 months of age.
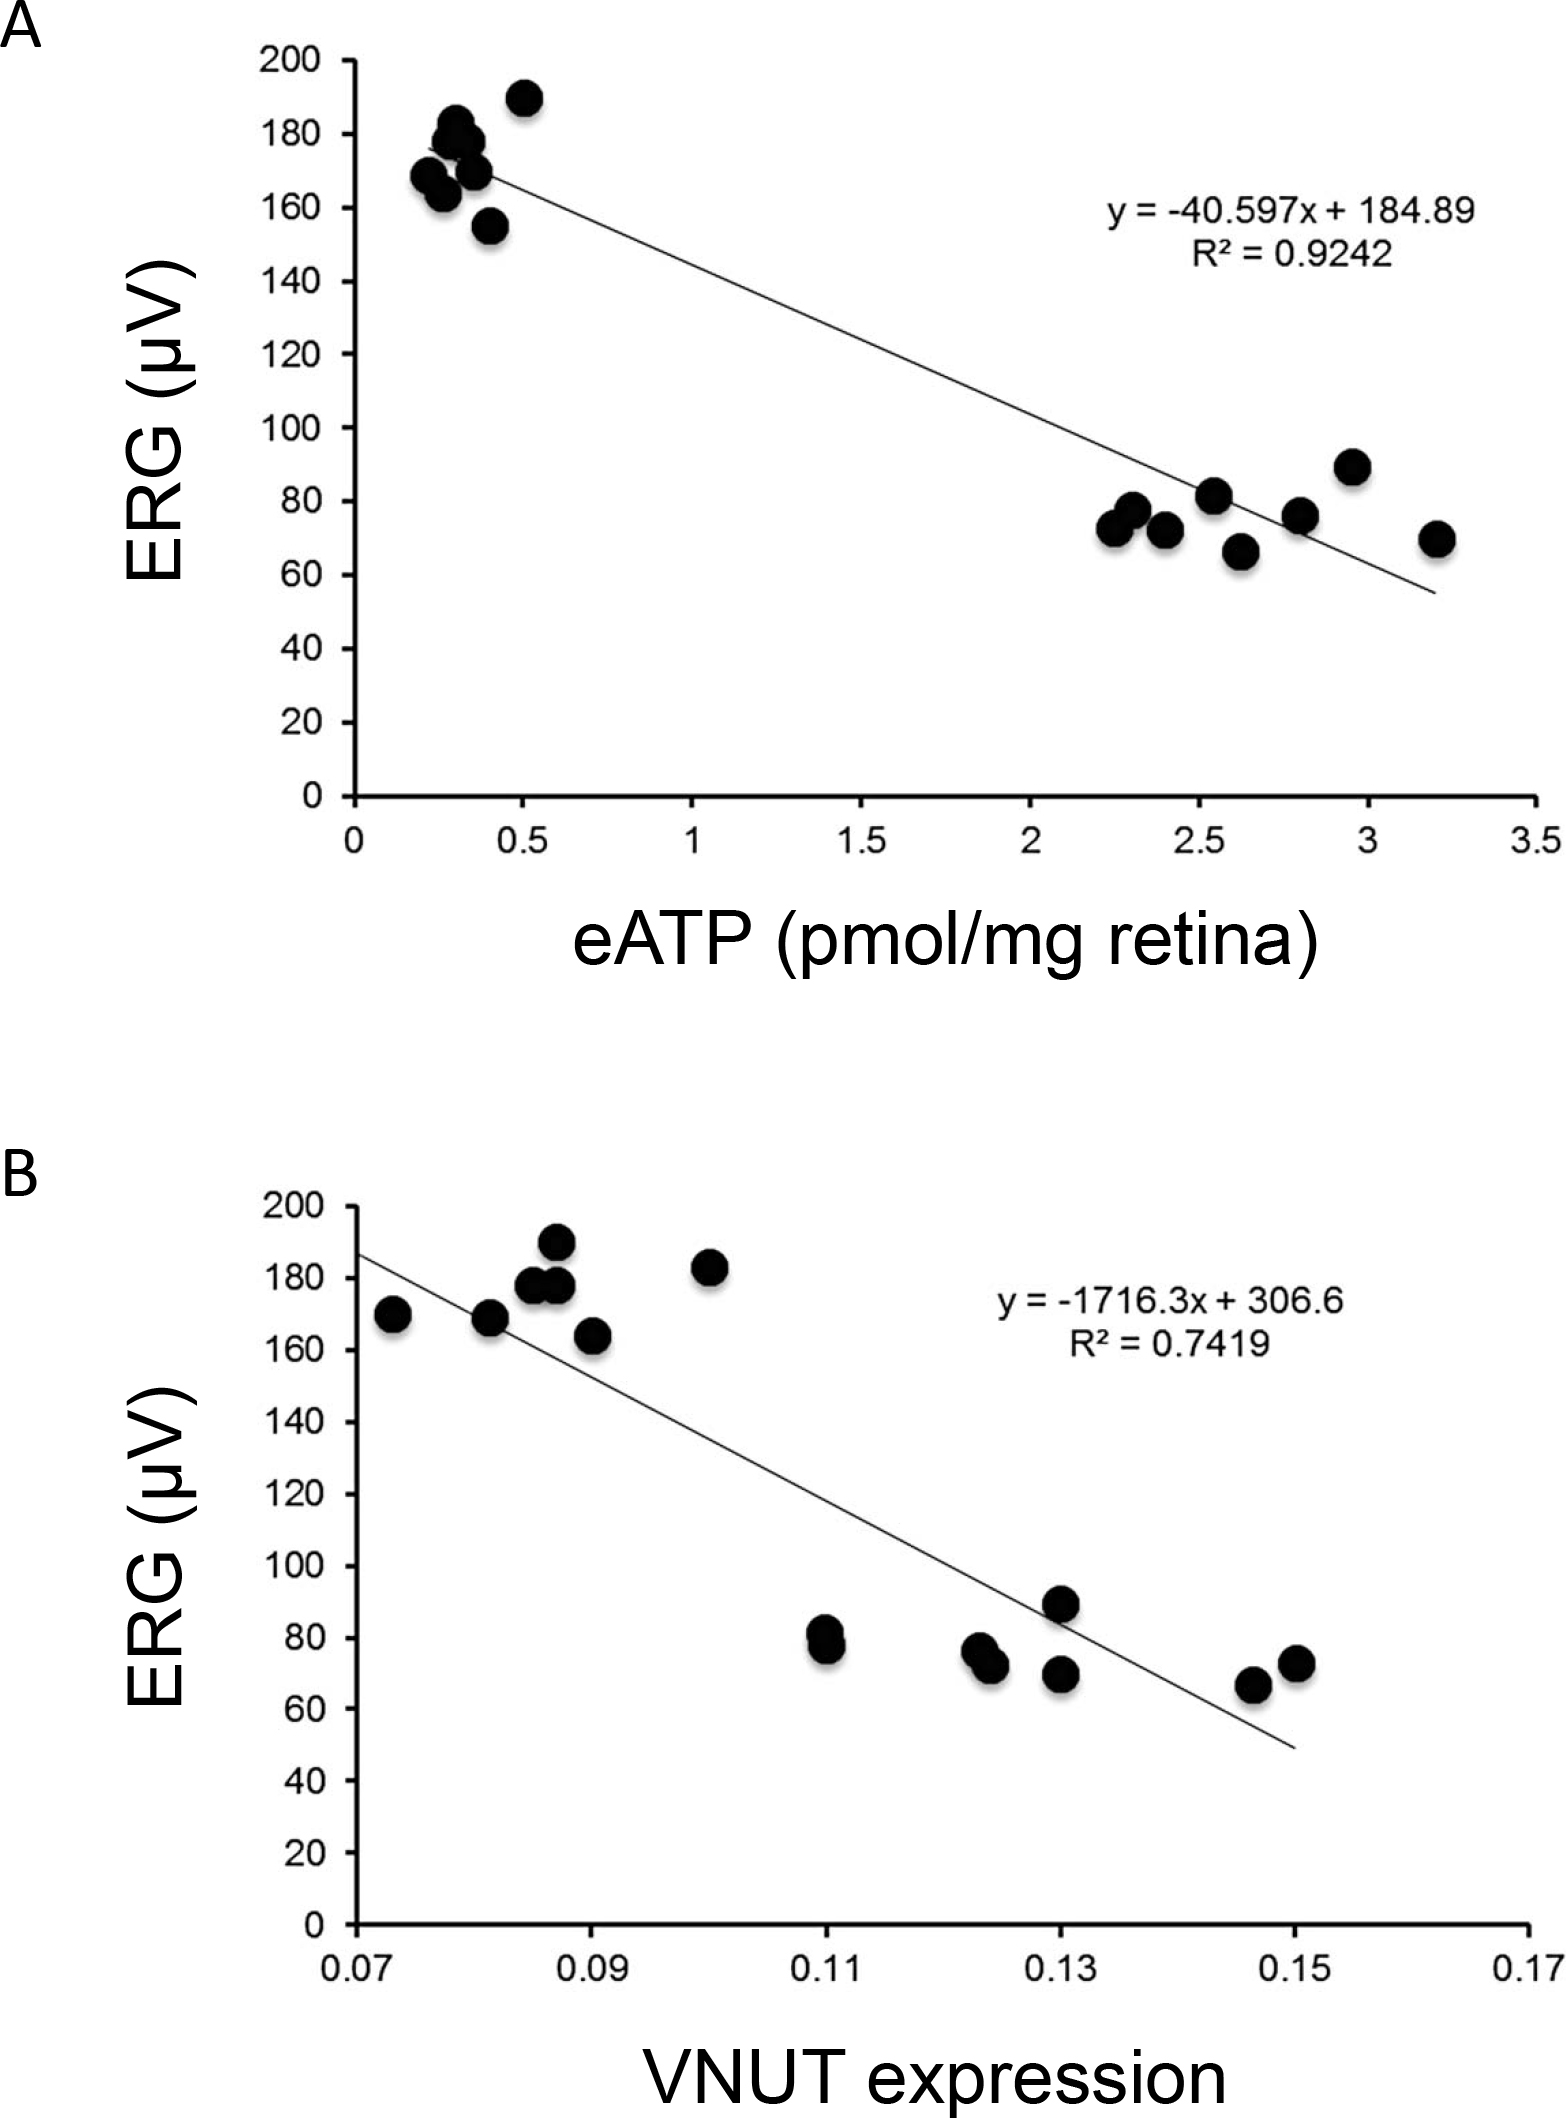
 Figure 3 of
Pérez de Lara, Mol Vis 2015; 21:1060-1070.
Figure 3 of
Pérez de Lara, Mol Vis 2015; 21:1060-1070.