Figure 2. Study of the ATP release in control (C57BL/6J) and glaucomatous (DBA/2J) mice. A: Basal and KCl stimulated ATP release from whole mount retinas obtained from the C57BL/6J mice. The left panel represents
the mean of the ATP amounts at the given mice ages either under basal (solid symbol) or stimulated conditions (open symbol).
The middle and right panels are representative high-pressure liquid chromatography (HPLC) elution profiles of basal (middle
panel) and stimulated conditions (right panel). B: Basal and KCl stimulated ATP release from whole mount retinas obtained from glaucomatous DBA/2J mice. The left panel shows
the mean of the ATP amounts at the given mice ages either under basal (solid symbol) or stimulated conditions (open symbol).
The middle and right panels are representative HPLC elution profiles of the basal (middle panel) and stimulated conditions
(right panel). C: Net ATP release in the glaucomatous DBA/2J mice (open circles) and the control C57BL/6J mice (open squares) followed from
3 to 22 months. D: Total ATP content in the retinas of the control and glaucomatous mice at the different ages under study (n=8). *p<0.05 between
9 and 15 months of age in the DBA/2J animals. #p<0.05 C57BL/6J mice versus DBA/2J mice at 15 months and ##p<0.01 C57BL/6J
versus DBA/2J mice at 22 months.
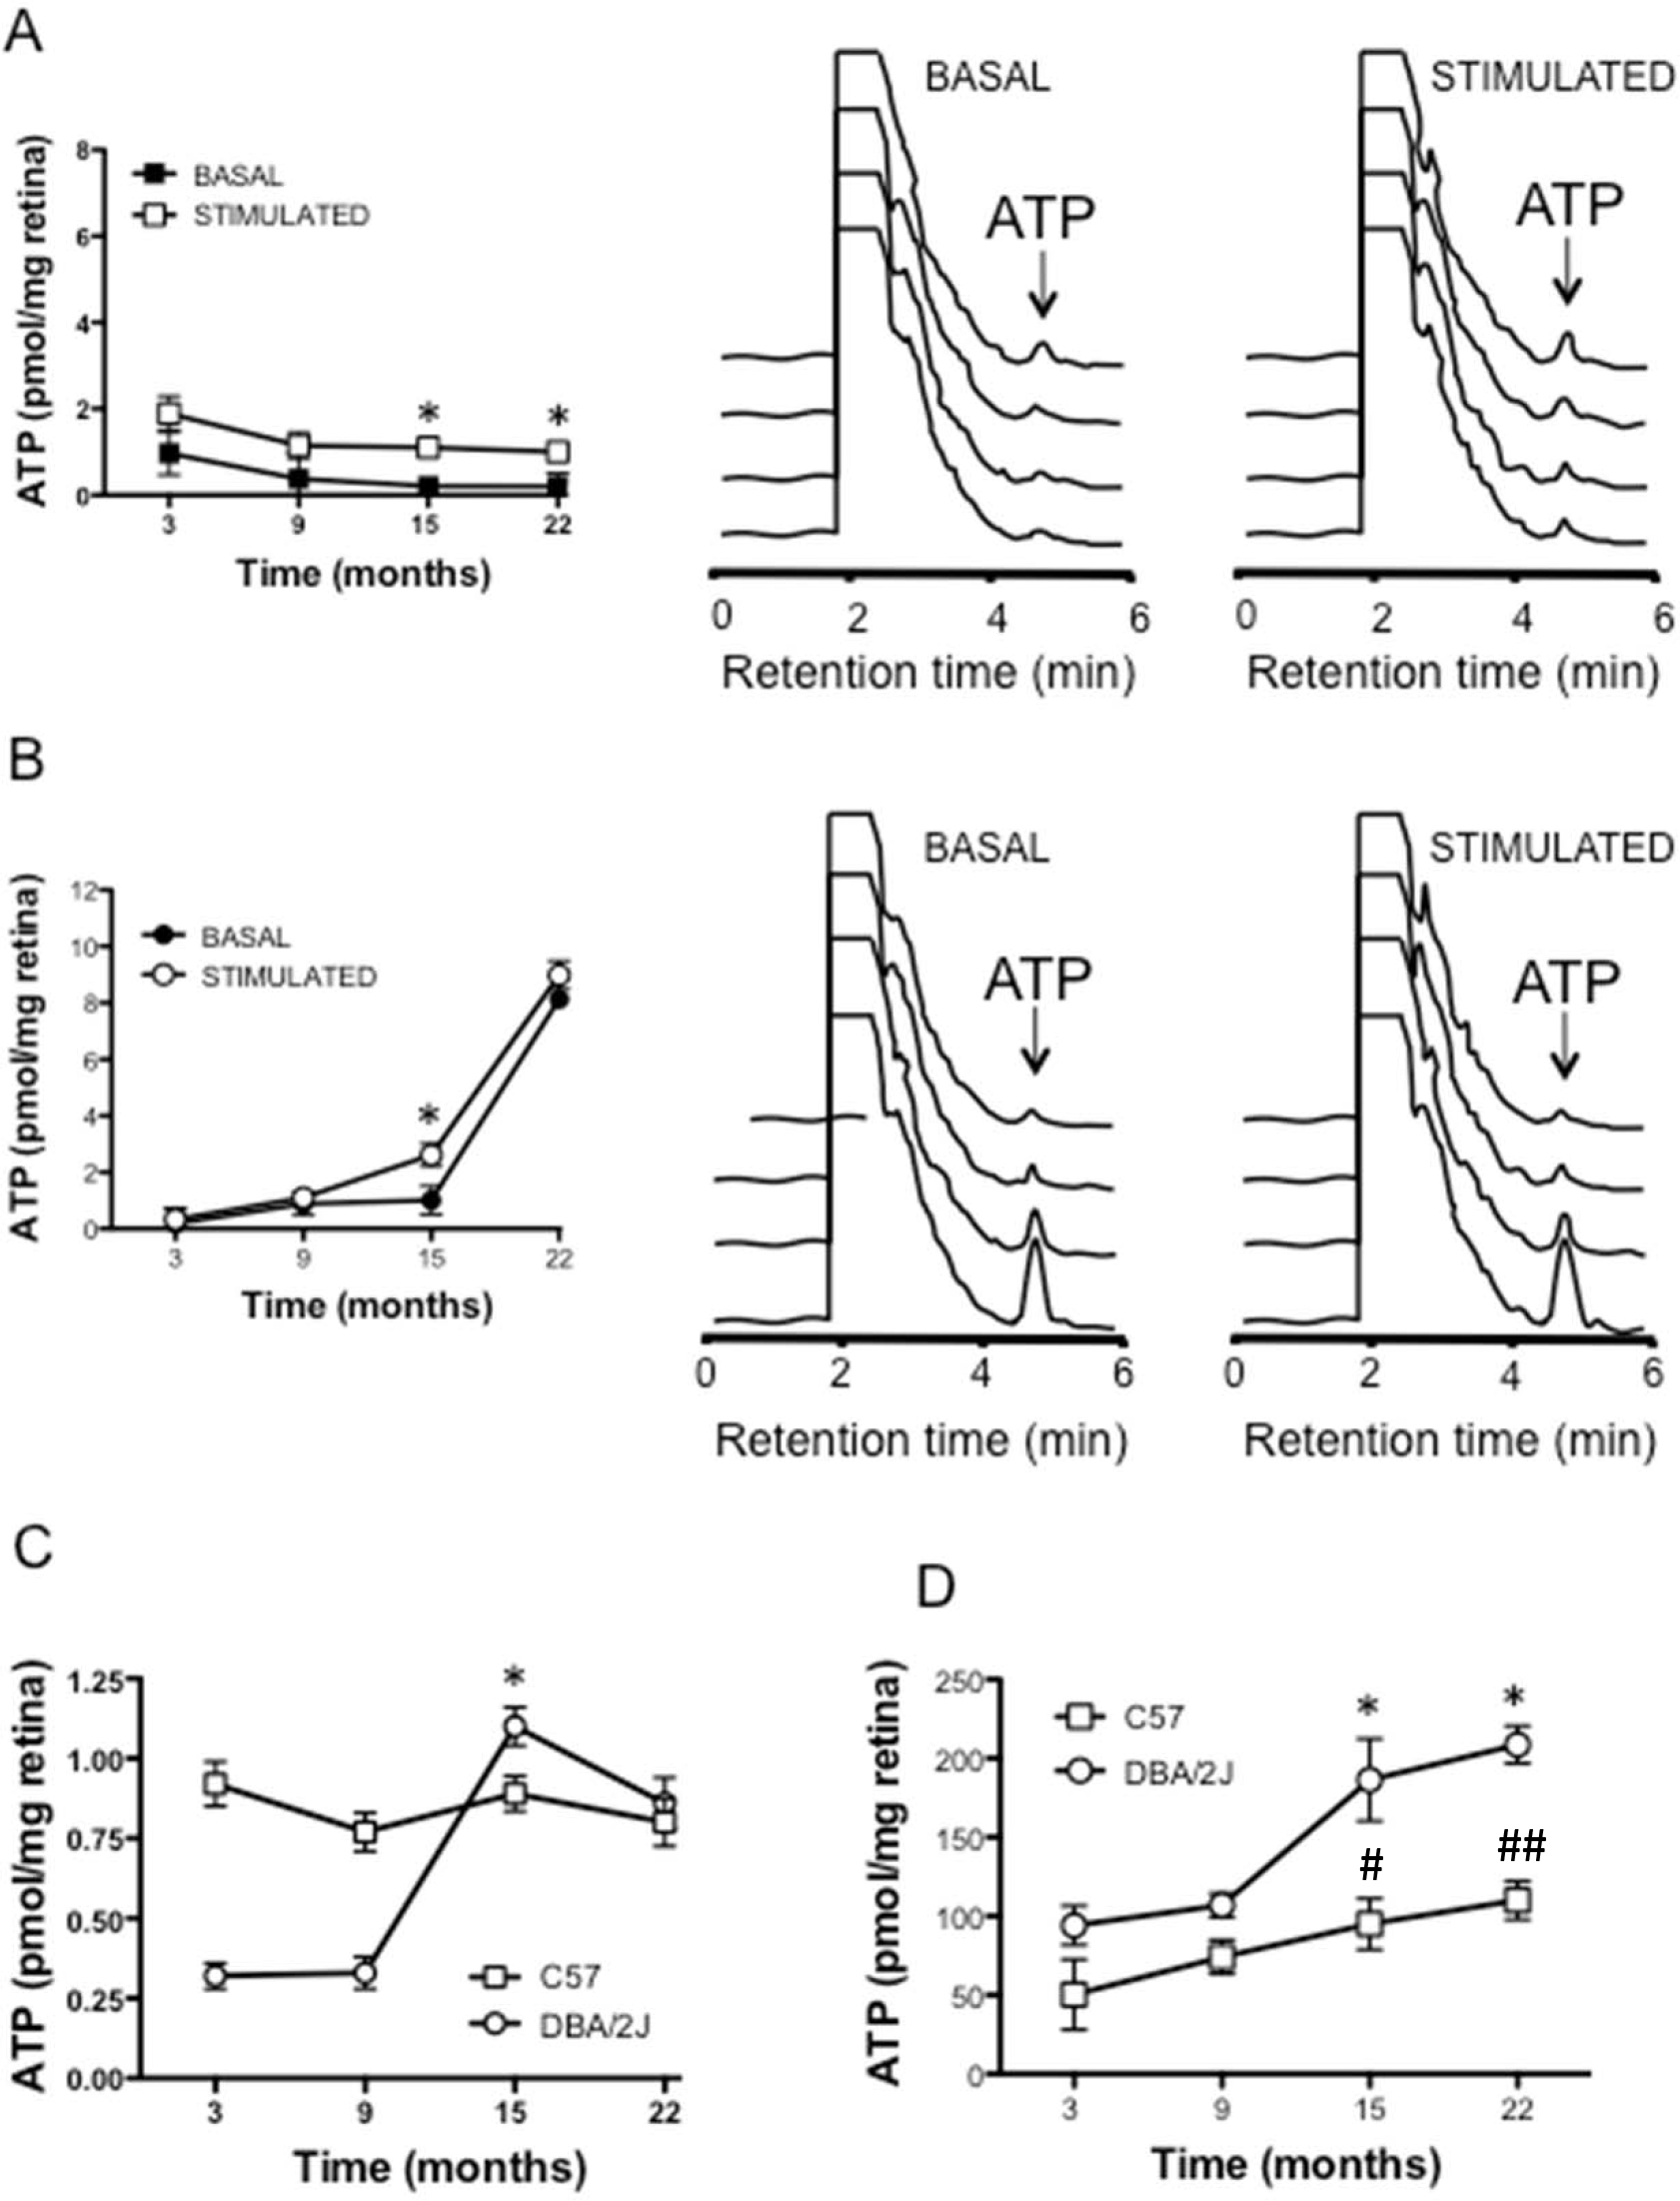
 Figure 2 of
Pérez de Lara, Mol Vis 2015; 21:1060-1070.
Figure 2 of
Pérez de Lara, Mol Vis 2015; 21:1060-1070.