Figure 2. Recruitment of T cells in illuminated C57BL/6 mice and effects in the chorioretinal layer. A-B: Number of CD4+ and CD8+ in pooled choroidal (A) and pooled retinal (B) cell suspensions from non-illuminated (NI) versus illuminated (d14) C57BL/6 mice (n = 4–6/group; ANOVA and Tukey test).
C: CXCL9 and CXCL10 protein expression in eyes from non-illuminated and light-challenged mice (n = 4/group, Mann–Whitney test)
4 days after the onset of illumination. D-E: Representative photomicrographs taken 1,000 μm from the optic nerve of a non-illuminated mouse (E) and from a C57BL/6 mouse
21 days following illumination (D). Scale bar: 20 µm. F: RPE thickness in µm2 in non-illuminated (n = 4) versus illuminated C57BL/6 mice (n = 7). Area under the curve (AUC) in illuminated and non-illuminated
C57BL/6 mice (Student t test) in the whole retina and restricted to the central retina. G: Quantitative–PCR of RPE65 mRNA of non-illuminated versus illuminated C57BL/6 mice (n = 5–6 per group, Student t test). H: Choroidal thickness in µm2 (-3,000 μm: inferior pole, +3,000 μm: superior pole, 0 μm; optic nerve) in young (n = 4) and old C57BL/6J mice (n = 7) in
the whole retina and restricted to the central retina. The AUC in illuminated and non-illuminated C57BL/6 mice (Student t test). ONL: Outer nuclear layer; ret: Retina; cho: Choroid; rpe; Retinal pigment epithelium. All scale bars represent 20
µm. All values are represented as mean ± standard error of the mean (SEM), *p≤0.05, **p≤0.01, ***p≤0.001.
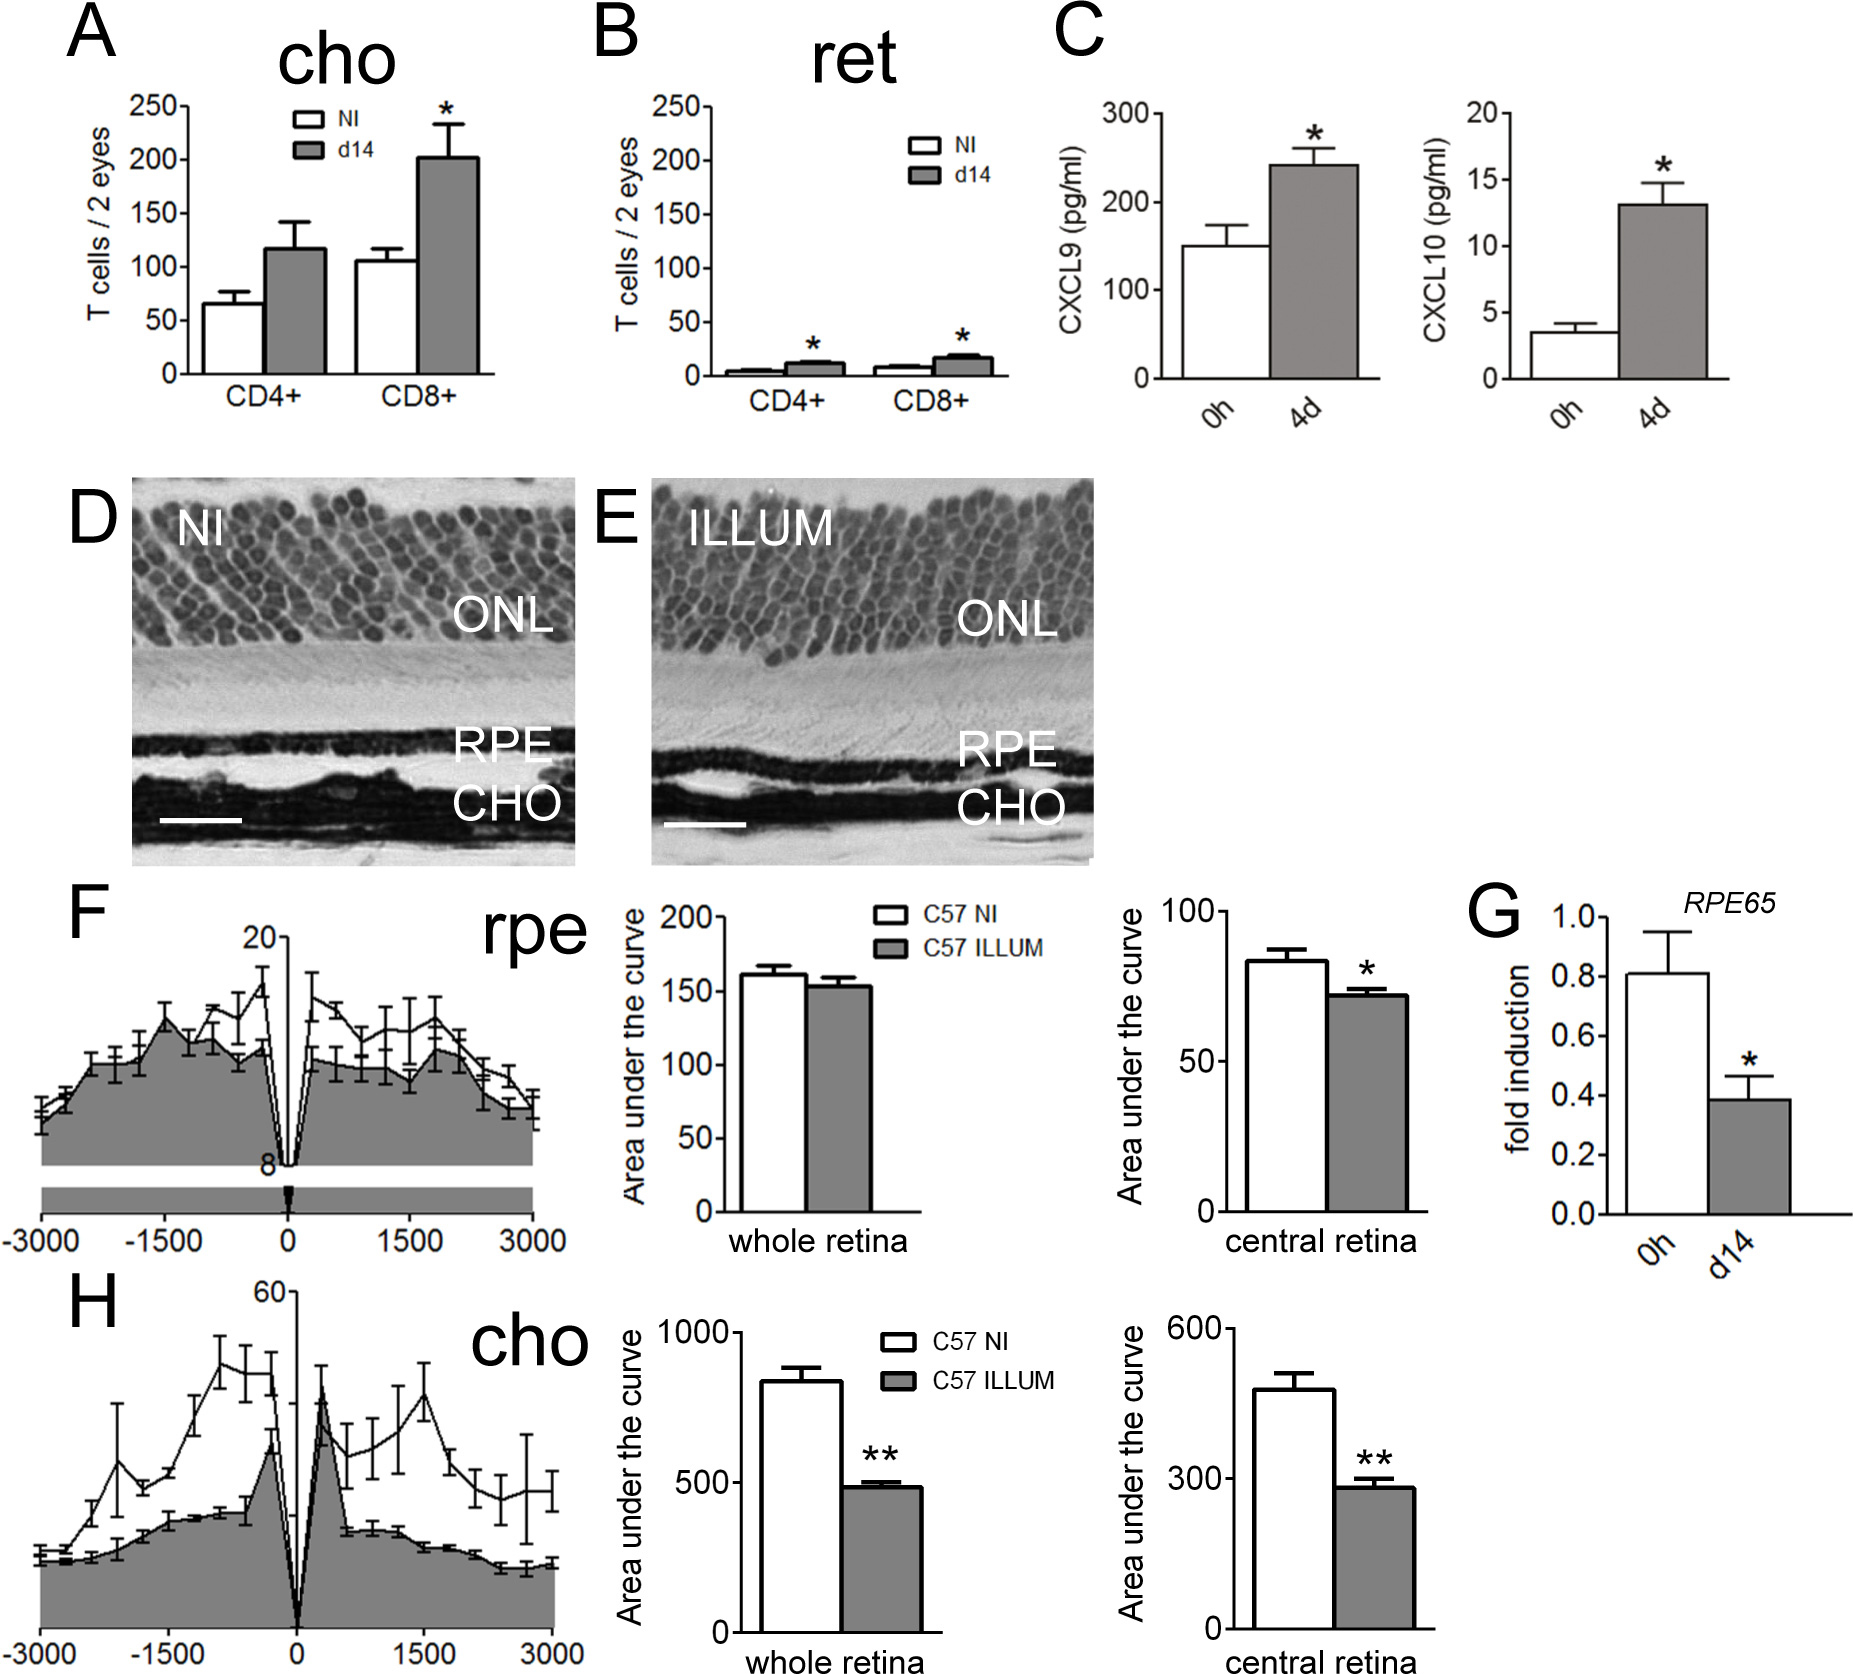
 Figure 2 of
Camelo, Mol Vis 2015; 21:1051-1059.
Figure 2 of
Camelo, Mol Vis 2015; 21:1051-1059.