Figure 6. Gal-1 expression in the rat posterior eye segment and ARPE-19 cells. A-C: Similar immunostain for galectin-1 (Gal-1) in the retina was detected in the control, lipopolysaccharide (LPS) and LPS +
recombinant Gal-1 (rGal-1) groups. Insets of figures A-C showed a detail of the RPE. D: No immunostaining was detected in the negative control section. Counterstain: hematoxylin. Bars: 20 μm. E-G: Immunogold electron micrograph on ARPE-19 cells under different conditions showing the localization of Gal-1 in the plasma
membrane (arrowhead), cytosol, and nucleus (N; arrows). Strong immunoreactivity for Gal-1 in the control cells (E) is shown compared to LPS-stimulated cells at 24 h with or without dexamethasone (Dex) treatment (F-G). H: Absence of gold labeling in sections incubated with nonimmune goat anti-rabbit serum (negative control). Bars: 0.5 μm. I: Densitometric analysis of Gal-1 expression in the layers of the retina (plexiform and ganglion cells) and the RPE. Values
(arbitrary units [a.u.]) are expressed as the mean ± SEM of Gal-1 immunoreactivity. J: Density of Gal-1 immunogold particles. Data are the mean ± SEM of gold particles per μm2. *p<0.05 versus control; #p<0.05 versus LPS 24 h.
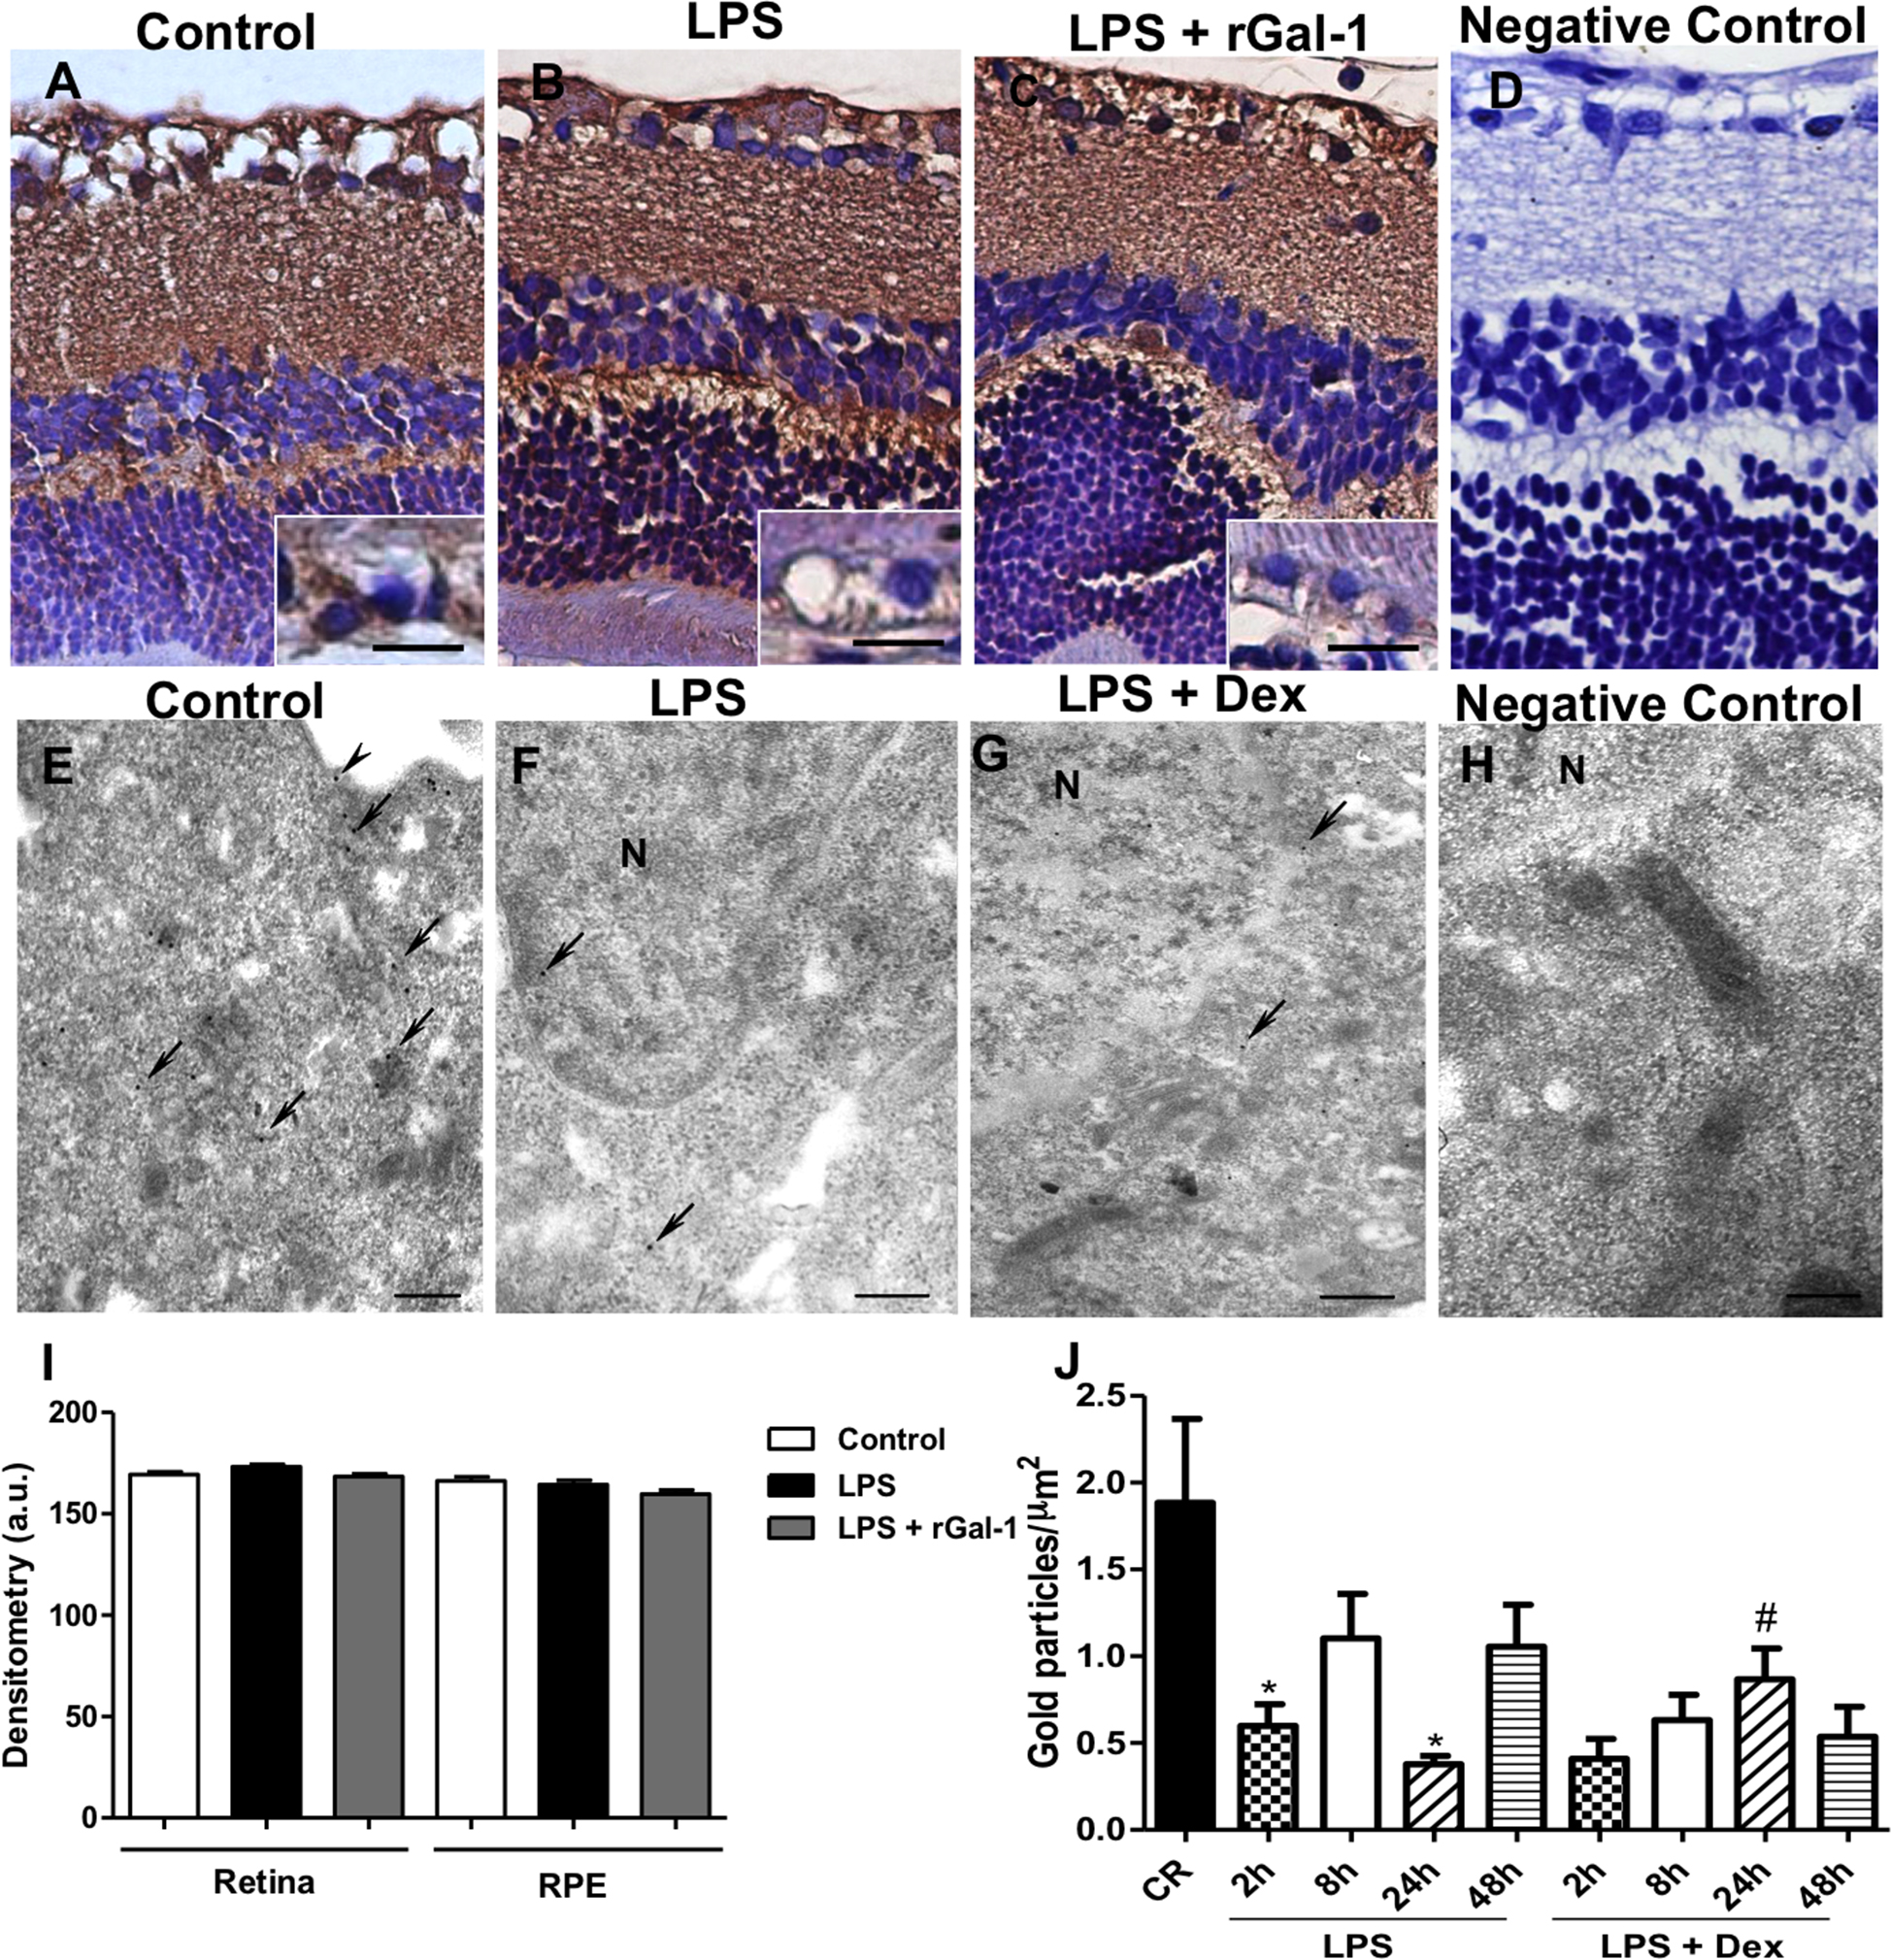
 Figure 6 of
Zanon, Mol Vis 2015; 21:1036-1050.
Figure 6 of
Zanon, Mol Vis 2015; 21:1036-1050.