Figure 5. Gal-1 expression in the anterior eye segment and eye supernatants. A: Galectin-1 (Gal-1) immunoreactivity in the epithelial cells of the cornea, B: ciliary body, and C: iris in the control group. D-F: Lipopolysaccharide (LPS) group with intense immunostaining in the epithelium. G-I: LPS + recombinant Gal-1 (rGal-1) group showing diminished Gal-1 expression in epithelial cells. J: No immunostaining was detected in the negative control section (without primary antibody). Counterstain: hematoxylin. Bars:
20 µm. K: Densitometric analysis of Gal-1 expression in epithelial cells. L: Representative western blot. Equal loading was confirmed using anti–β-actin. Immunoreactive protein bands were semiquantified
via densitometry and expressed in arbitrary units (a.u.) relative to β-actin. Values (a.u.) are presented as the mean ± SEM
of sections analyzed (n = 5). *p<0.05, **p<0.01, ***p<0.001 versus control; ###p<0.001 versus LPS.
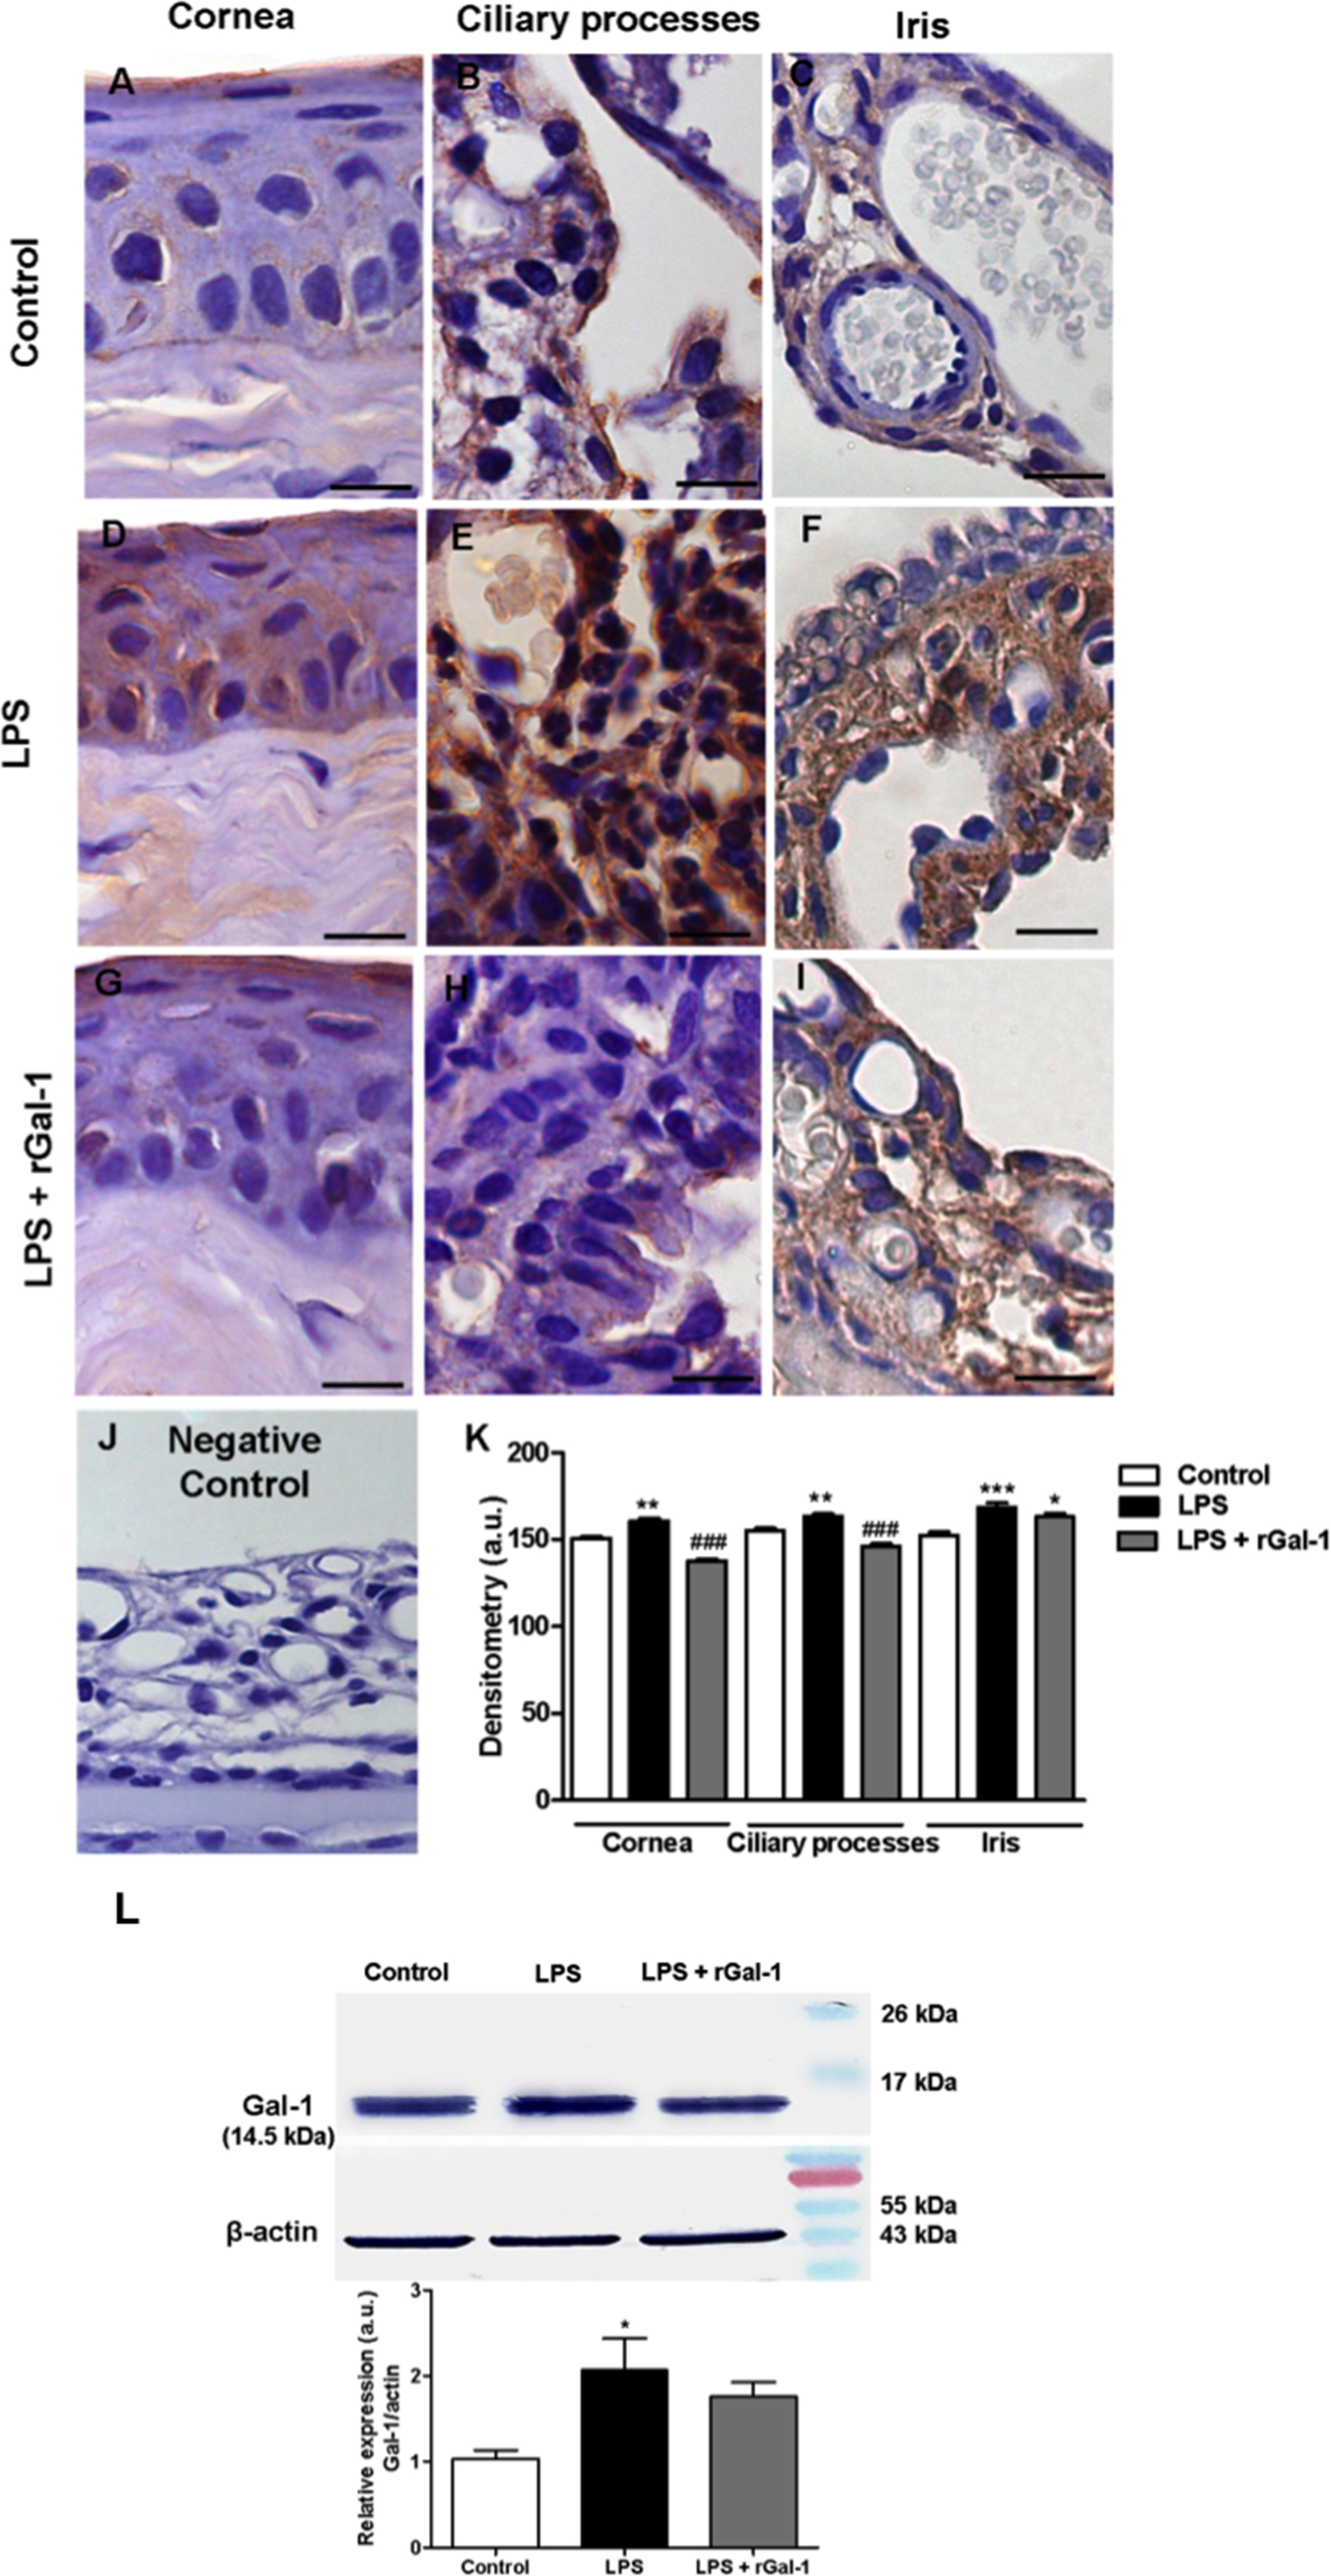
 Figure 5 of
Zanon, Mol Vis 2015; 21:1036-1050.
Figure 5 of
Zanon, Mol Vis 2015; 21:1036-1050.