Figure 1. rGal-1 alleviated inflammation in EIU experimental model in rats. A–C: Absence of neutrophils in control ocular tissues. D–F: Influx of neutrophils (arrows) in the ciliary processes, limbus, and retina 24 h after the induction of uveitis by lipopolysaccharide
(LPS). G–I: After treatment with recombinant galectin-1 (rGal-1). Sections: 1 µm. Scale bars, 20 µm. J, K: Quantitative analysis of neutrophils in the anterior (J) and posterior segments (K) of the eye. Values represented mean ± SEM of the number of neutrophils/mm2 (n = 5) ***p<0.001, **p<0.01 versus control; ##p<0.01 versus LPS.
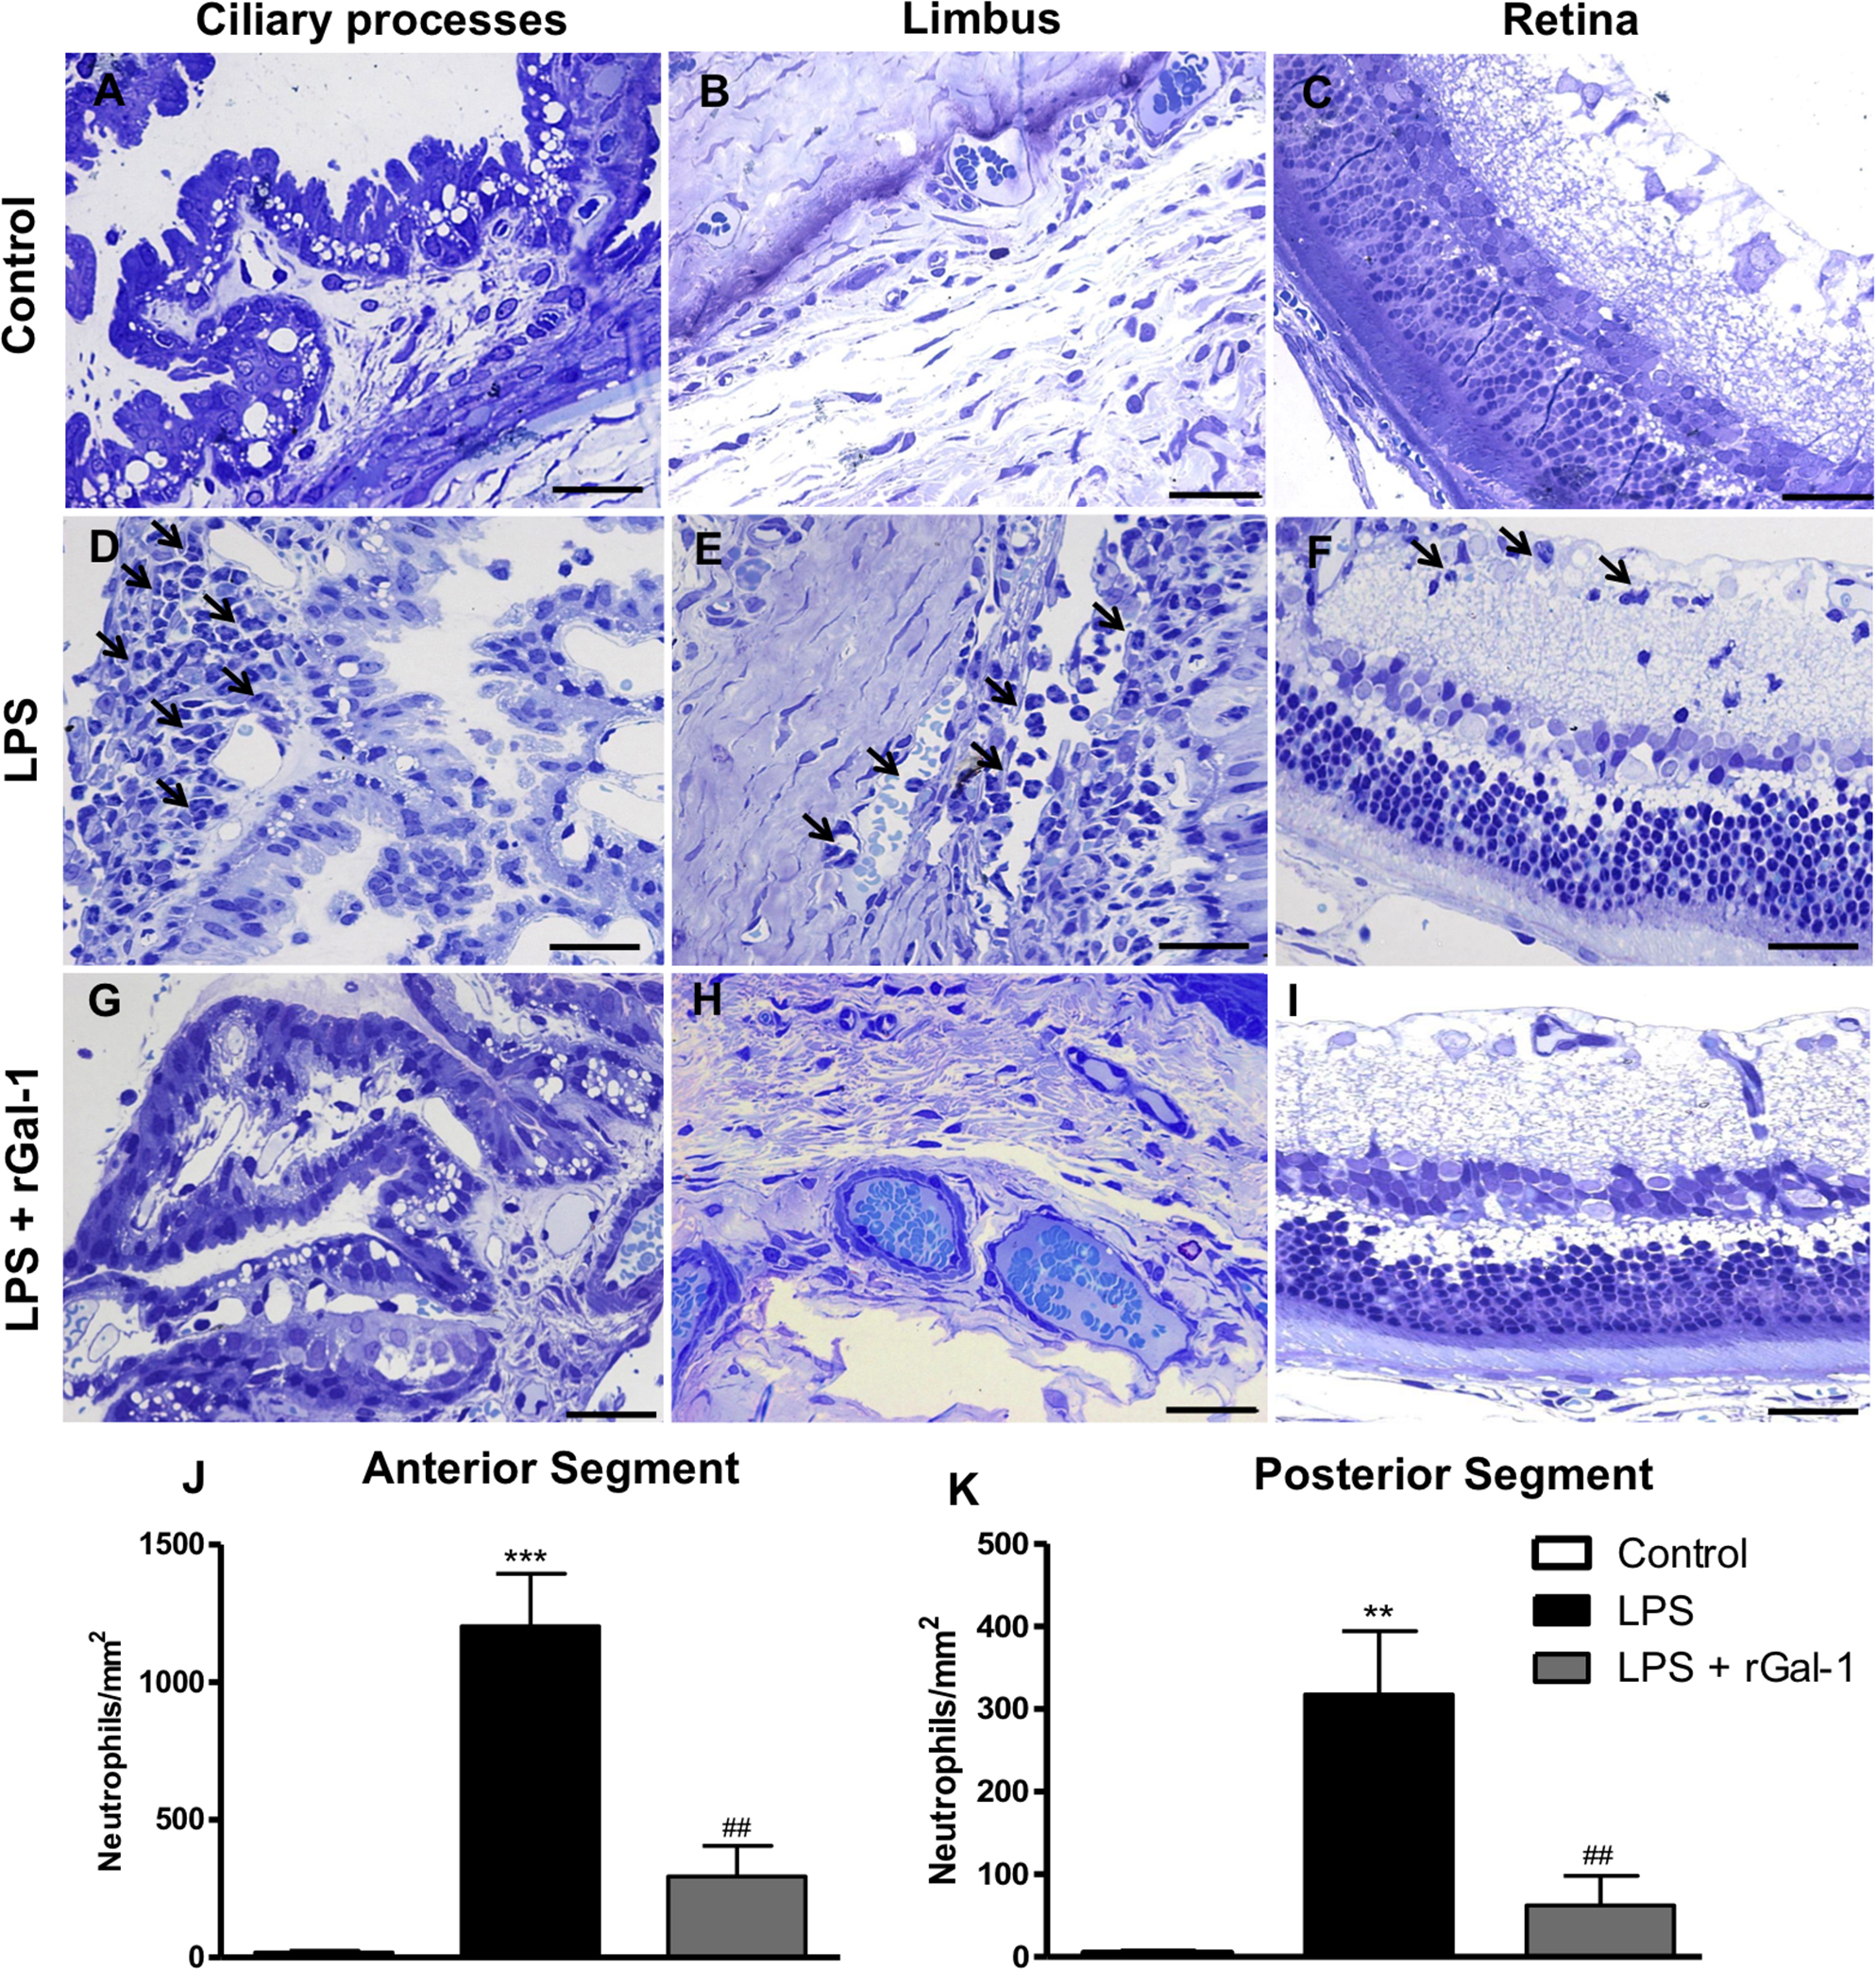
 Figure 1 of
Zanon, Mol Vis 2015; 21:1036-1050.
Figure 1 of
Zanon, Mol Vis 2015; 21:1036-1050.