Figure 9. Involvement of transcription factor activities in the poly(I:C; 500 µg/ml)-induced gene expression in RPE cells. The cellular
levels of the following gene transcripts were determined: TLR3 (A), bFGF (B), TNFα (C), IL-1β (D), MCP-1 (E), and CFB (F) mRNAs. mRNA levels were determined with real-time RT–PCR analysis after stimulation of near-confluent cultures for 2 h (TNFα
and IL-1β mRNAs) and 6 h (TLR3, bFGF, MCP-1, and CFB mRNAs), respectively, and are expressed as folds of unstimulated controls.
The following blocking agents were tested: an HIF inhibitor (HIF-Inh; 5 µM), the NF-κB inhibitor caffeic acid phenethyl ester
(CAPE; 5 µM), and the STAT3 inhibitor Stattic (1 µM). Vehicle control was made with DMSO (DMSO; 1:1000). Each bar represents
data obtained in 3 to 8 independent RPE cell lines, each from a different human eye donor; experiments with each cell line
were carried out in triplicate. Significant difference versus unstimulated controls: *p<0.05. Significant difference versus
poly(I:C) controls: ●p<0.05.
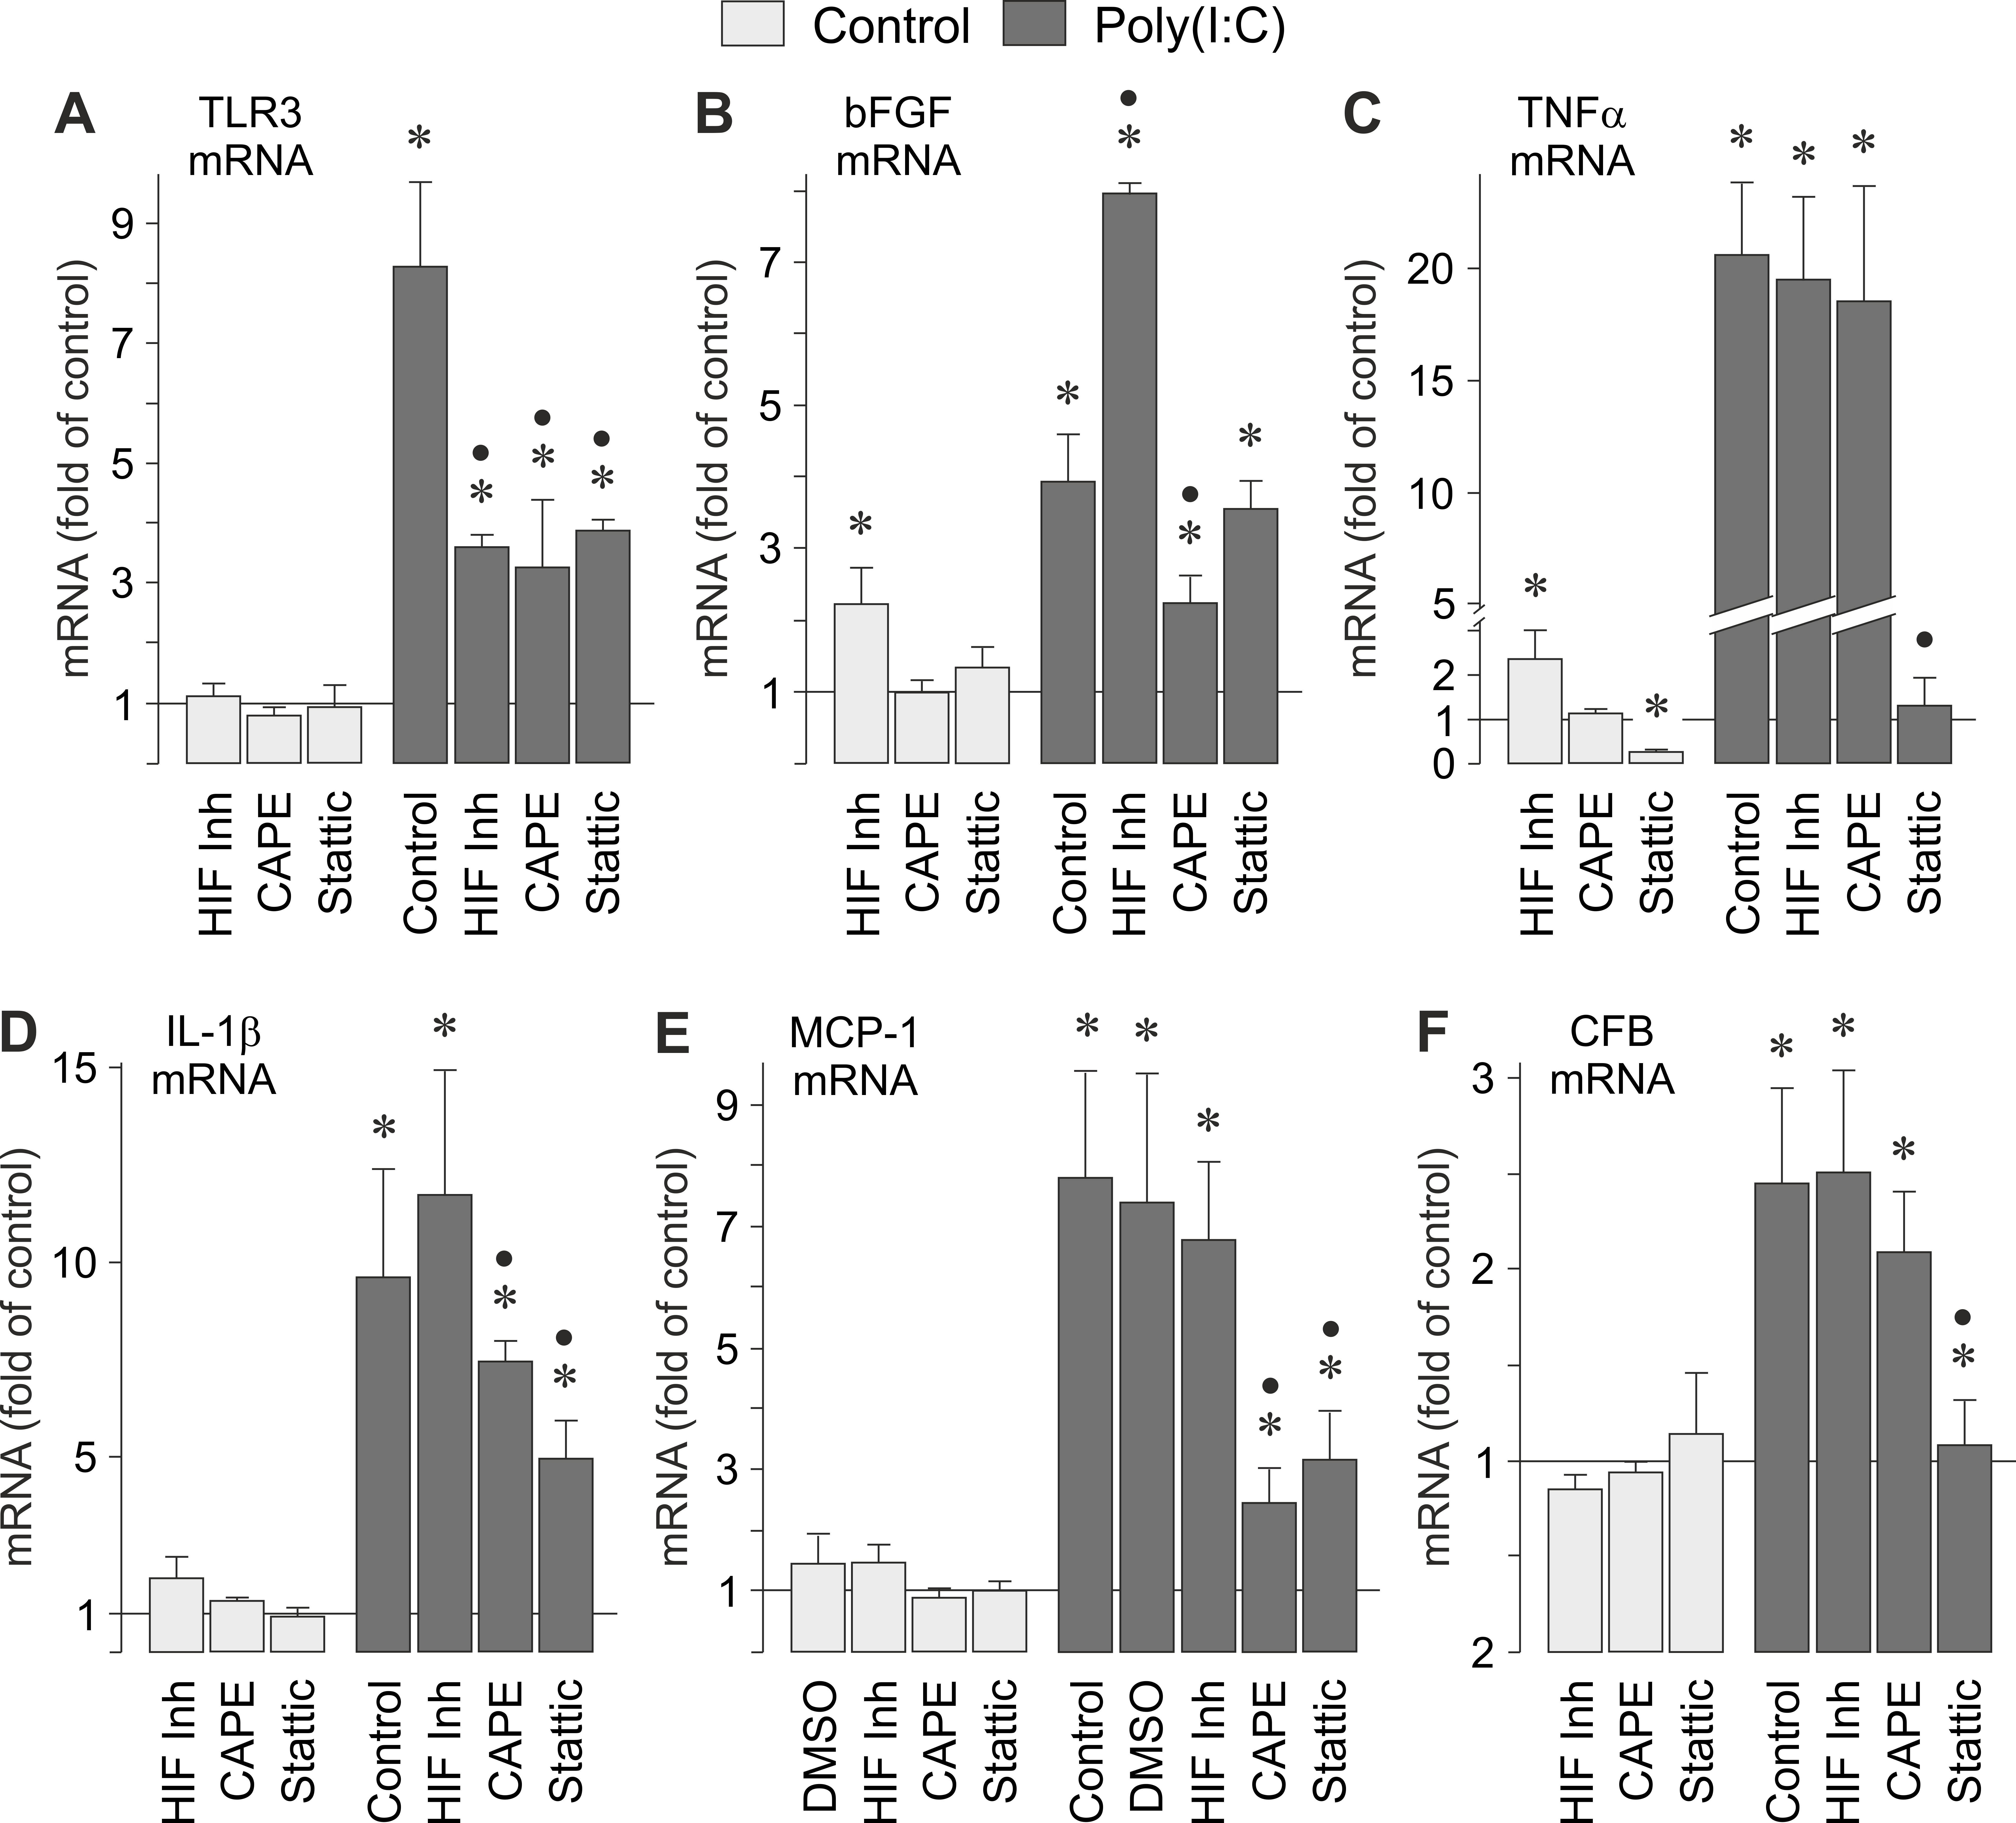
 Figure 9 of
Brosig, Mol Vis 2015; 21:1000-1016.
Figure 9 of
Brosig, Mol Vis 2015; 21:1000-1016.