 Appendix 5 of
Caines, Mol Vis 2015; 21:1-11.
Appendix 5 of
Caines, Mol Vis 2015; 21:1-11. Appendix 5 of
Caines, Mol Vis 2015; 21:1-11.
Appendix 5.
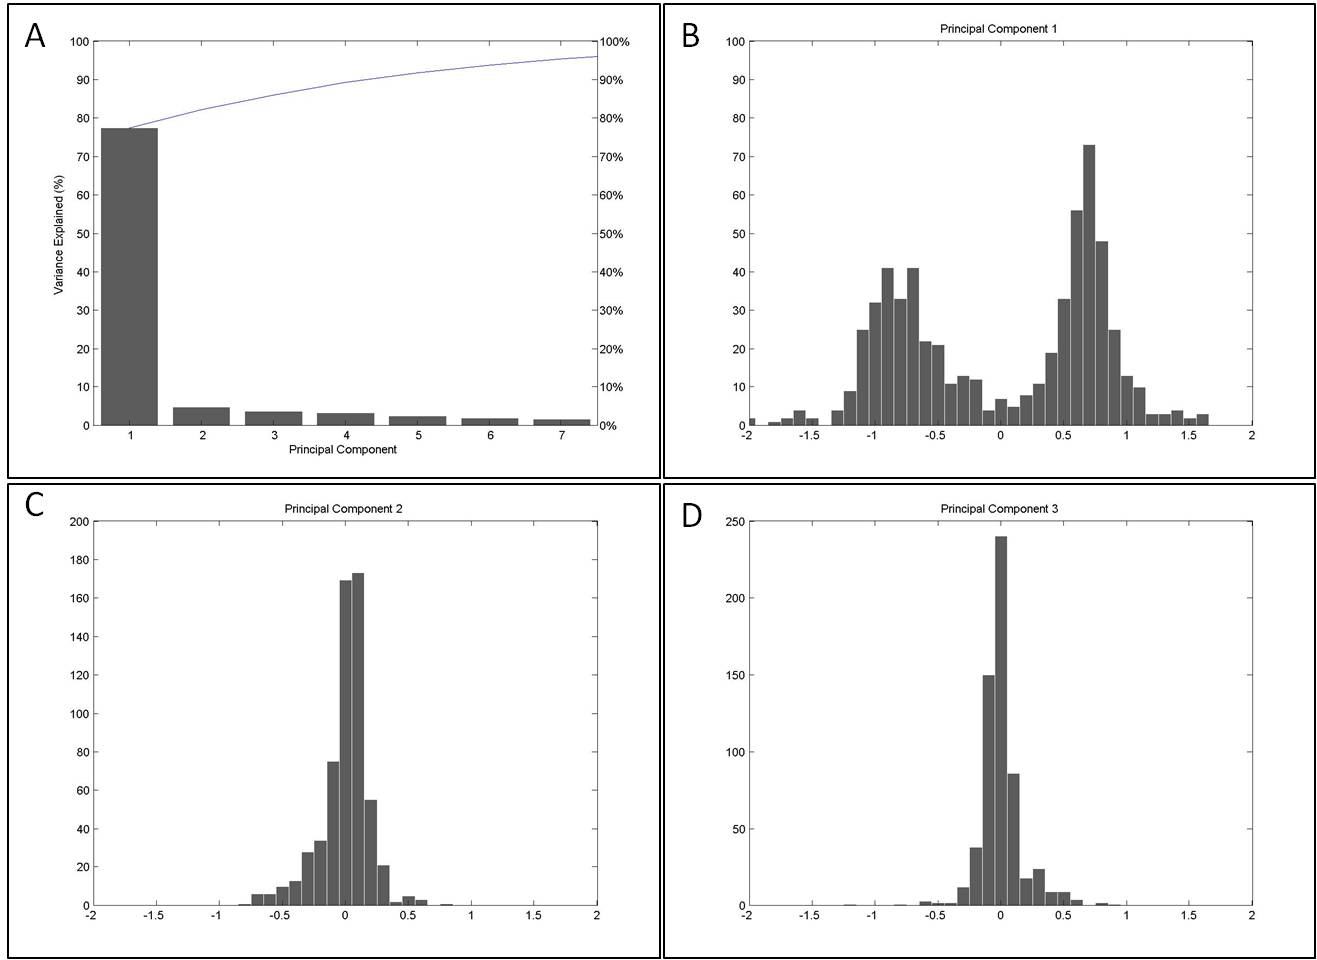
To access the data, click or select the words “Appendix 5.” Principal Component Analysis of chromosome 3 data. (A): Scree plot showing the distribution of variance (and ≥95% cumulative variance) over the first seven components. Nearly 80% of the total variance is contained within the first principle component. (B, C, D): Distribution of the data in the first three principle components, the bimodality is now exposed exclusively in the first component, and the variance reduces in successive components as the distributions become progressively narrower and taller (note the change in vertical scale for constant bin widths).