 Appendix 3 of
Caines, Mol Vis 2015; 21:1-11.
Appendix 3 of
Caines, Mol Vis 2015; 21:1-11. Appendix 3 of
Caines, Mol Vis 2015; 21:1-11.
Appendix 3.
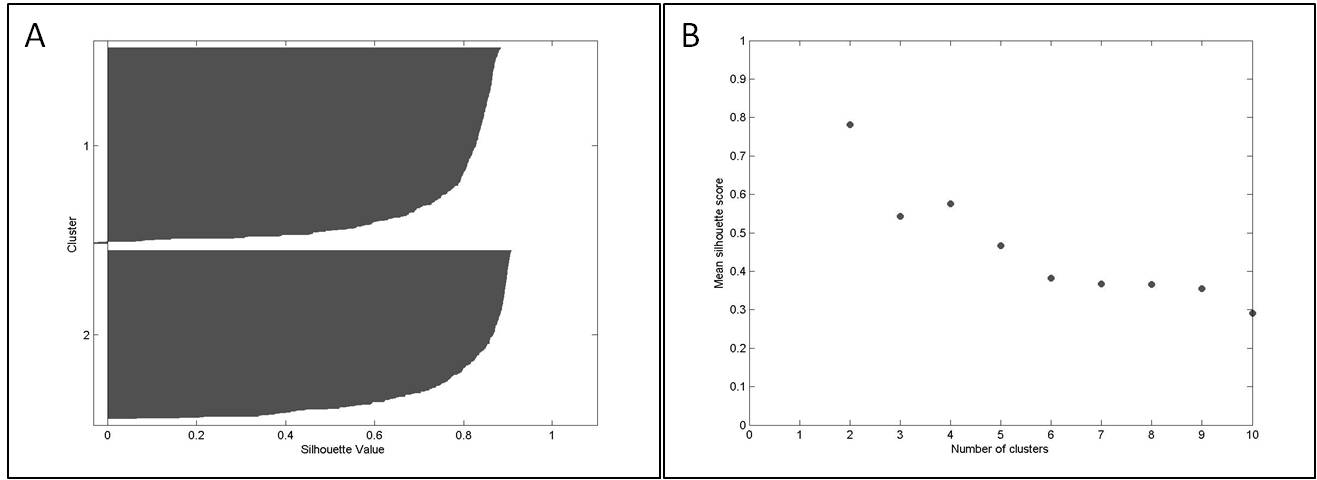
To access the data, click or select the words “Appendix 3.” (A) Silhouette scores plotted horizontally for the 602 data points when k=2, indicating the majority of points have a silhouette score in the range 0.6 - 0.9. (B) A plot of mean silhouette score against k, indicating the optimum clustering solution has been found at k=2.