 Appendix 1 of
Caines, Mol Vis 2015; 21:1-11.
Appendix 1 of
Caines, Mol Vis 2015; 21:1-11. Appendix 1 of
Caines, Mol Vis 2015; 21:1-11.
Appendix 1.
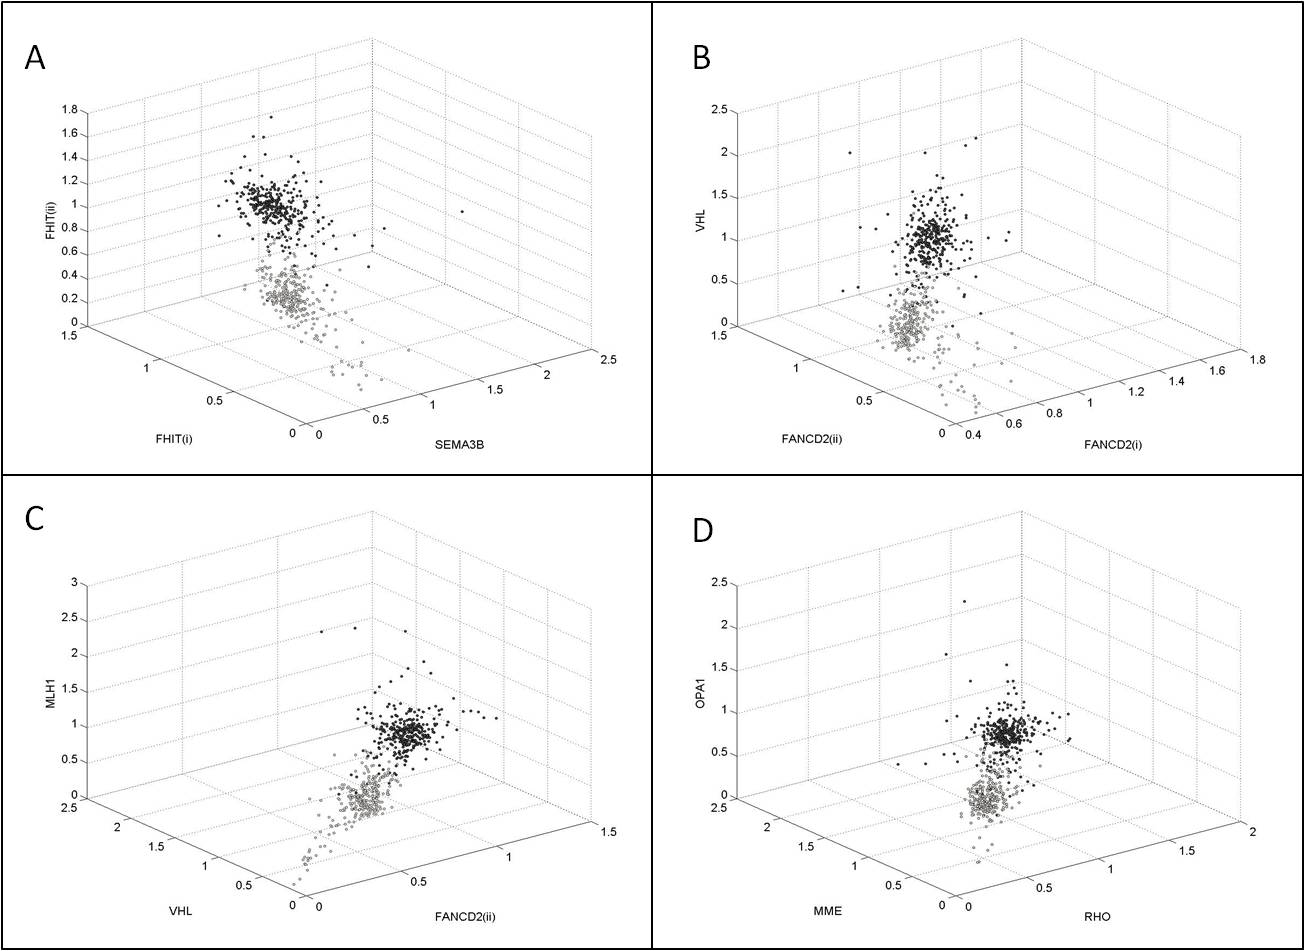
To access the data, click or select the words “Appendix 1.” Some examples of 3D projections with each point classified according to the output of the kmeans algorithm, for k=2. The clusters appear better defined in some projections than others, but the intuitive overall picture seems to have been well captured by the algorithm.