Figure 5. Effects of atropine treatment on collagen type I and Regulator of G-protein signaling 2 (RGS2) expression in the sclera of
form deprivation myopia (FDM) eyes. Real-time-PCR analysis of collagen type I (A) and RGS2 (C) mRNA expression levels in the sclera of guinea pigs. Data were analyzed by the 2–ΔΔCT method and normalized to internal control β-actin as described in the Methods (n = 10 samples in each group). Western blots
of collagen type I (B) and RGS2 (D) protein expression levels in the sclera of guinea pigs (top panels), analyzed by measuring band density and normalized by
the internal control β-tubulin (n = 10 samples in each group). mRNA and protein expression levels were normalized and expressed
as fold change (ratio of atropine group to saline group). Data shown are mean±SEM. Statistical analysis was performed on the
mean data using a Student t test, *p<0.05 compared to the saline control.
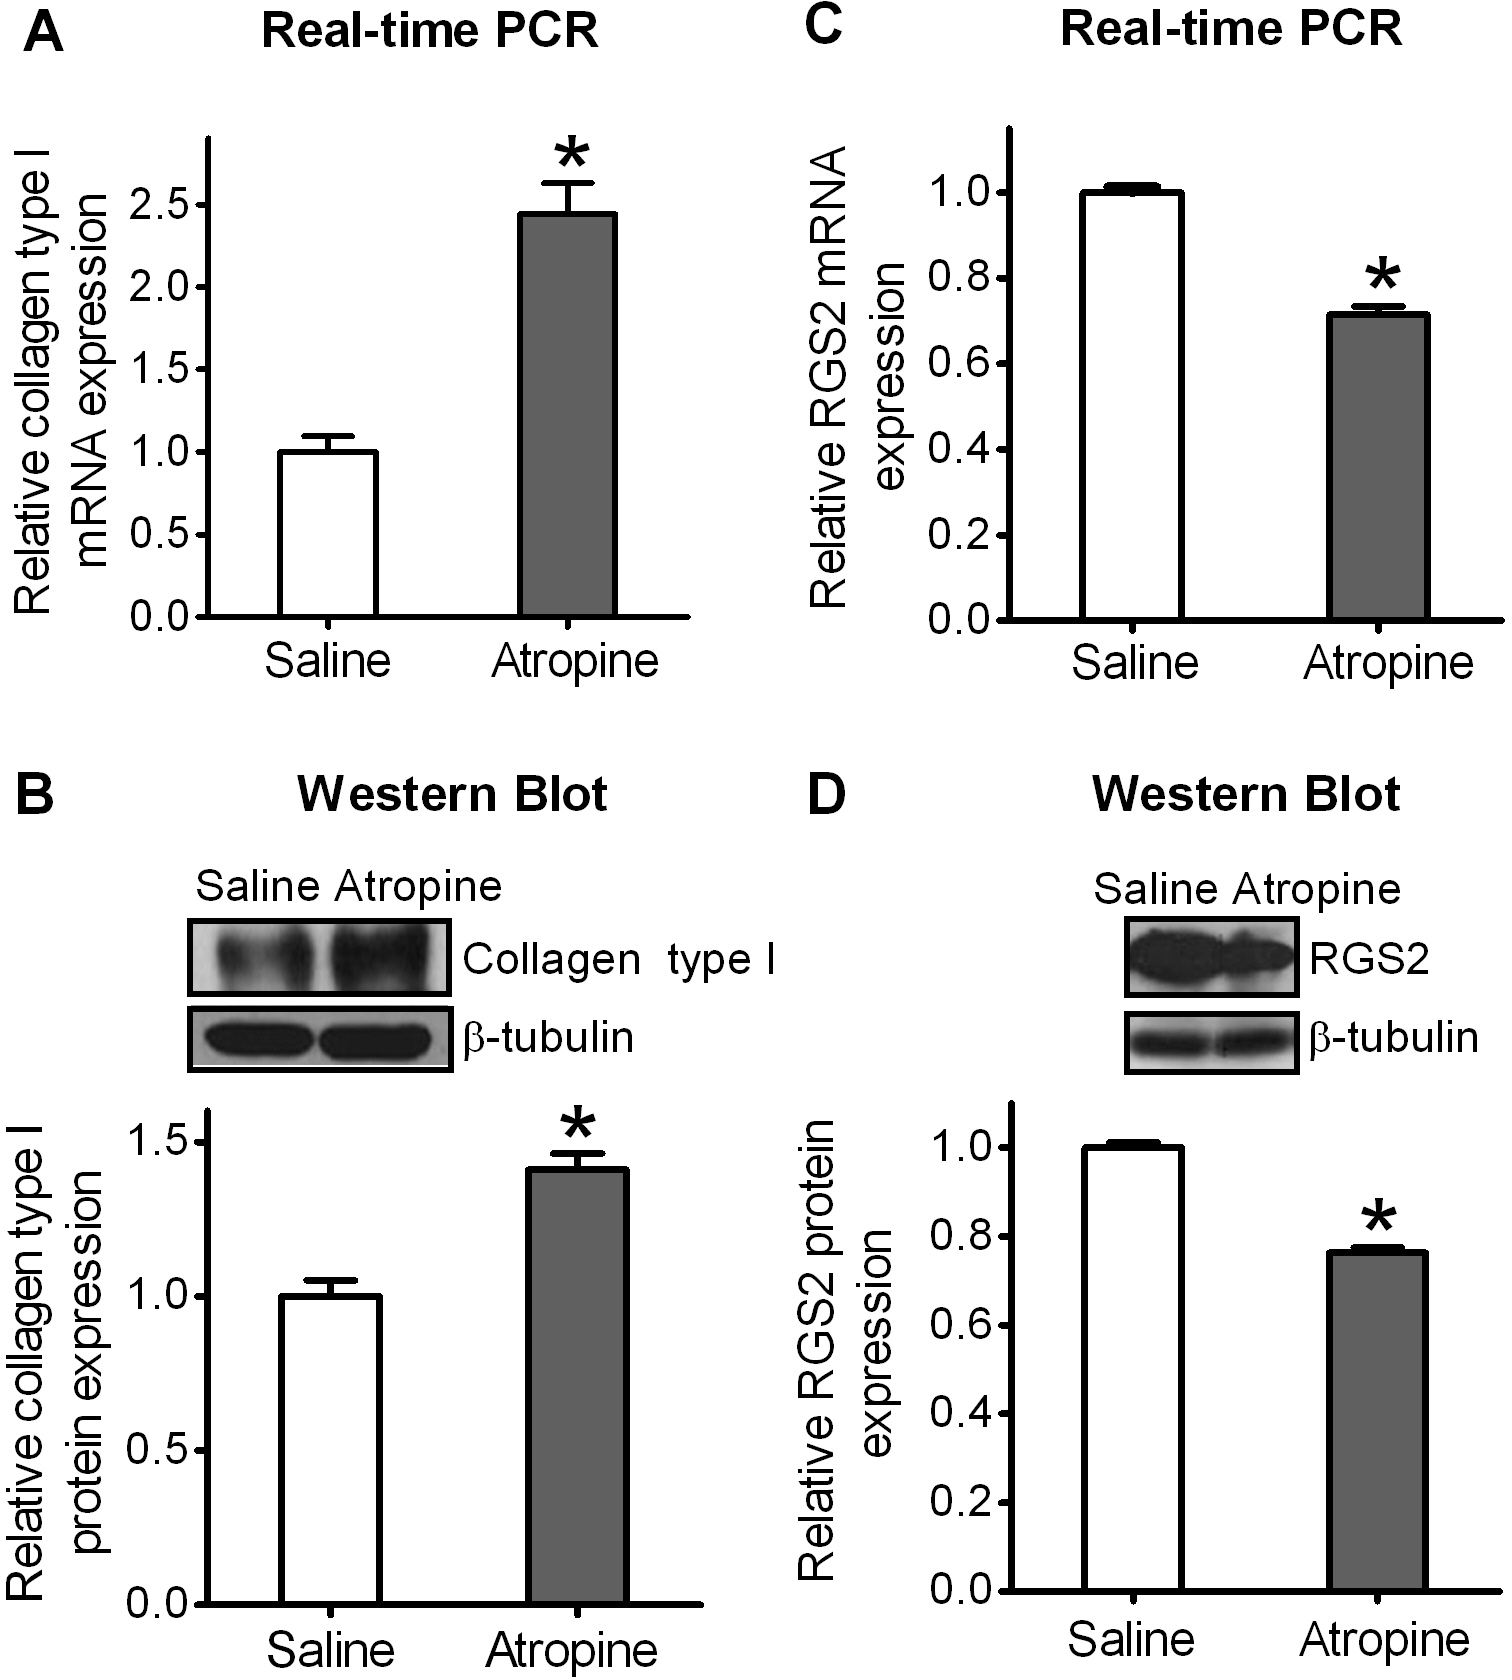
 Figure 5 of
Zou, Mol Vis 2014; 20:977-987.
Figure 5 of
Zou, Mol Vis 2014; 20:977-987.