Figure 2. Scleral collagen type I downregulation induced by form deprivation (FD).A: Real-time-PCR analysis of collagen type I mRNA expression levels in the sclera of guinea pigs. Data were analyzed by the
2–ΔΔCT method and normalized to internal control β-actin as described in the Methods (n = 10 samples in each group). B: Western blot analysis of collagen type I protein expression level in guinea pig sclera (inset), analyzed by measuring band
density and normalized to β-tubulin (n = 10 samples in each group). mRNA and protein expression levels were normalized and
expressed as fold change (ratio of treated group to normal eye group). Data shown are mean±SEM. Statistical analysis was performed
on the mean data using a Student t test, *p<0.05 compared to the control.
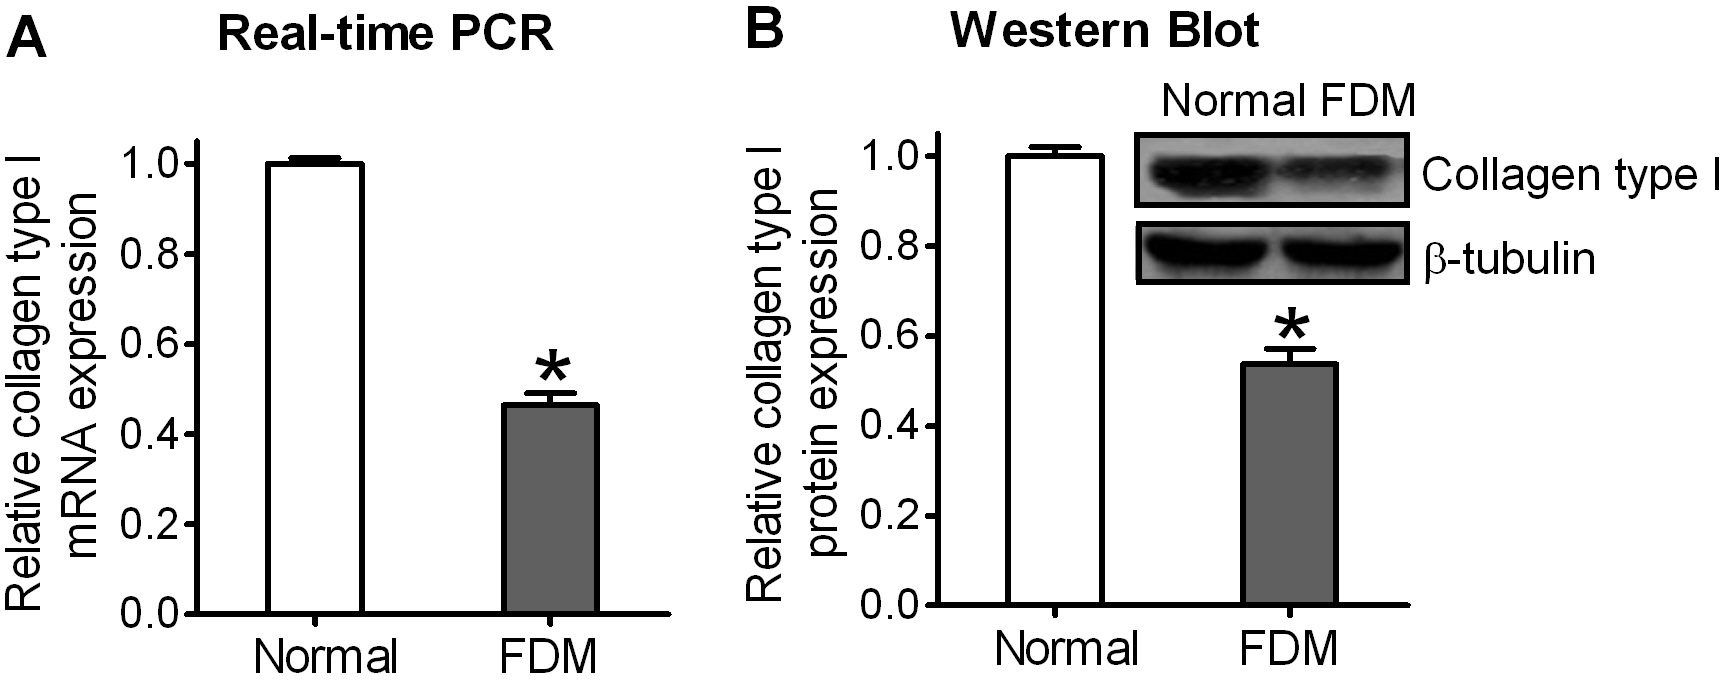
 Figure 2 of
Zou, Mol Vis 2014; 20:977-987.
Figure 2 of
Zou, Mol Vis 2014; 20:977-987.