Figure 1. Form deprivation (FD) induced thinning in sclera. A: Representative photomicrographs of scleral sections stained with H&E in normal and form deprivation myopia (FDM) eyes. B: Quantitative analysis of the thickness of the sclera by Soft CellA Imaging Software (n = 10 eyes in each group, six sections from each eye). Each point represents mean±SEM. Statistical analysis
was performed on the mean data from each guinea pig using a Student t test, *p<0.05 compared to the control. Arrows indicate the sclera. Scale bar is 50 µm.
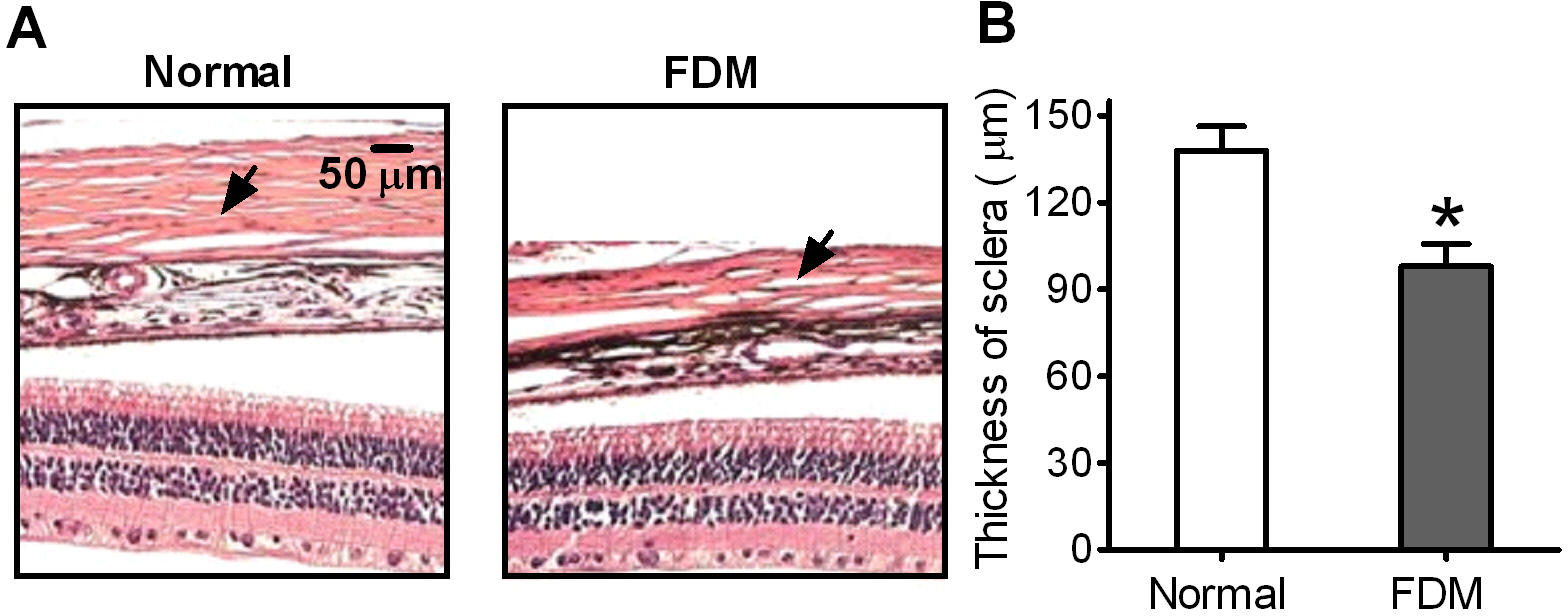
 Figure 1 of
Zou, Mol Vis 2014; 20:977-987.
Figure 1 of
Zou, Mol Vis 2014; 20:977-987.