Figure 5. Distribution of the map location of our identified genes (“foveome”). All but one of our genes associated with the Y chromosome
were also associated with the X chromosome (“X+Y”).Description of the frequency of Gene Ontology annotations ascribed to our
identified genes.
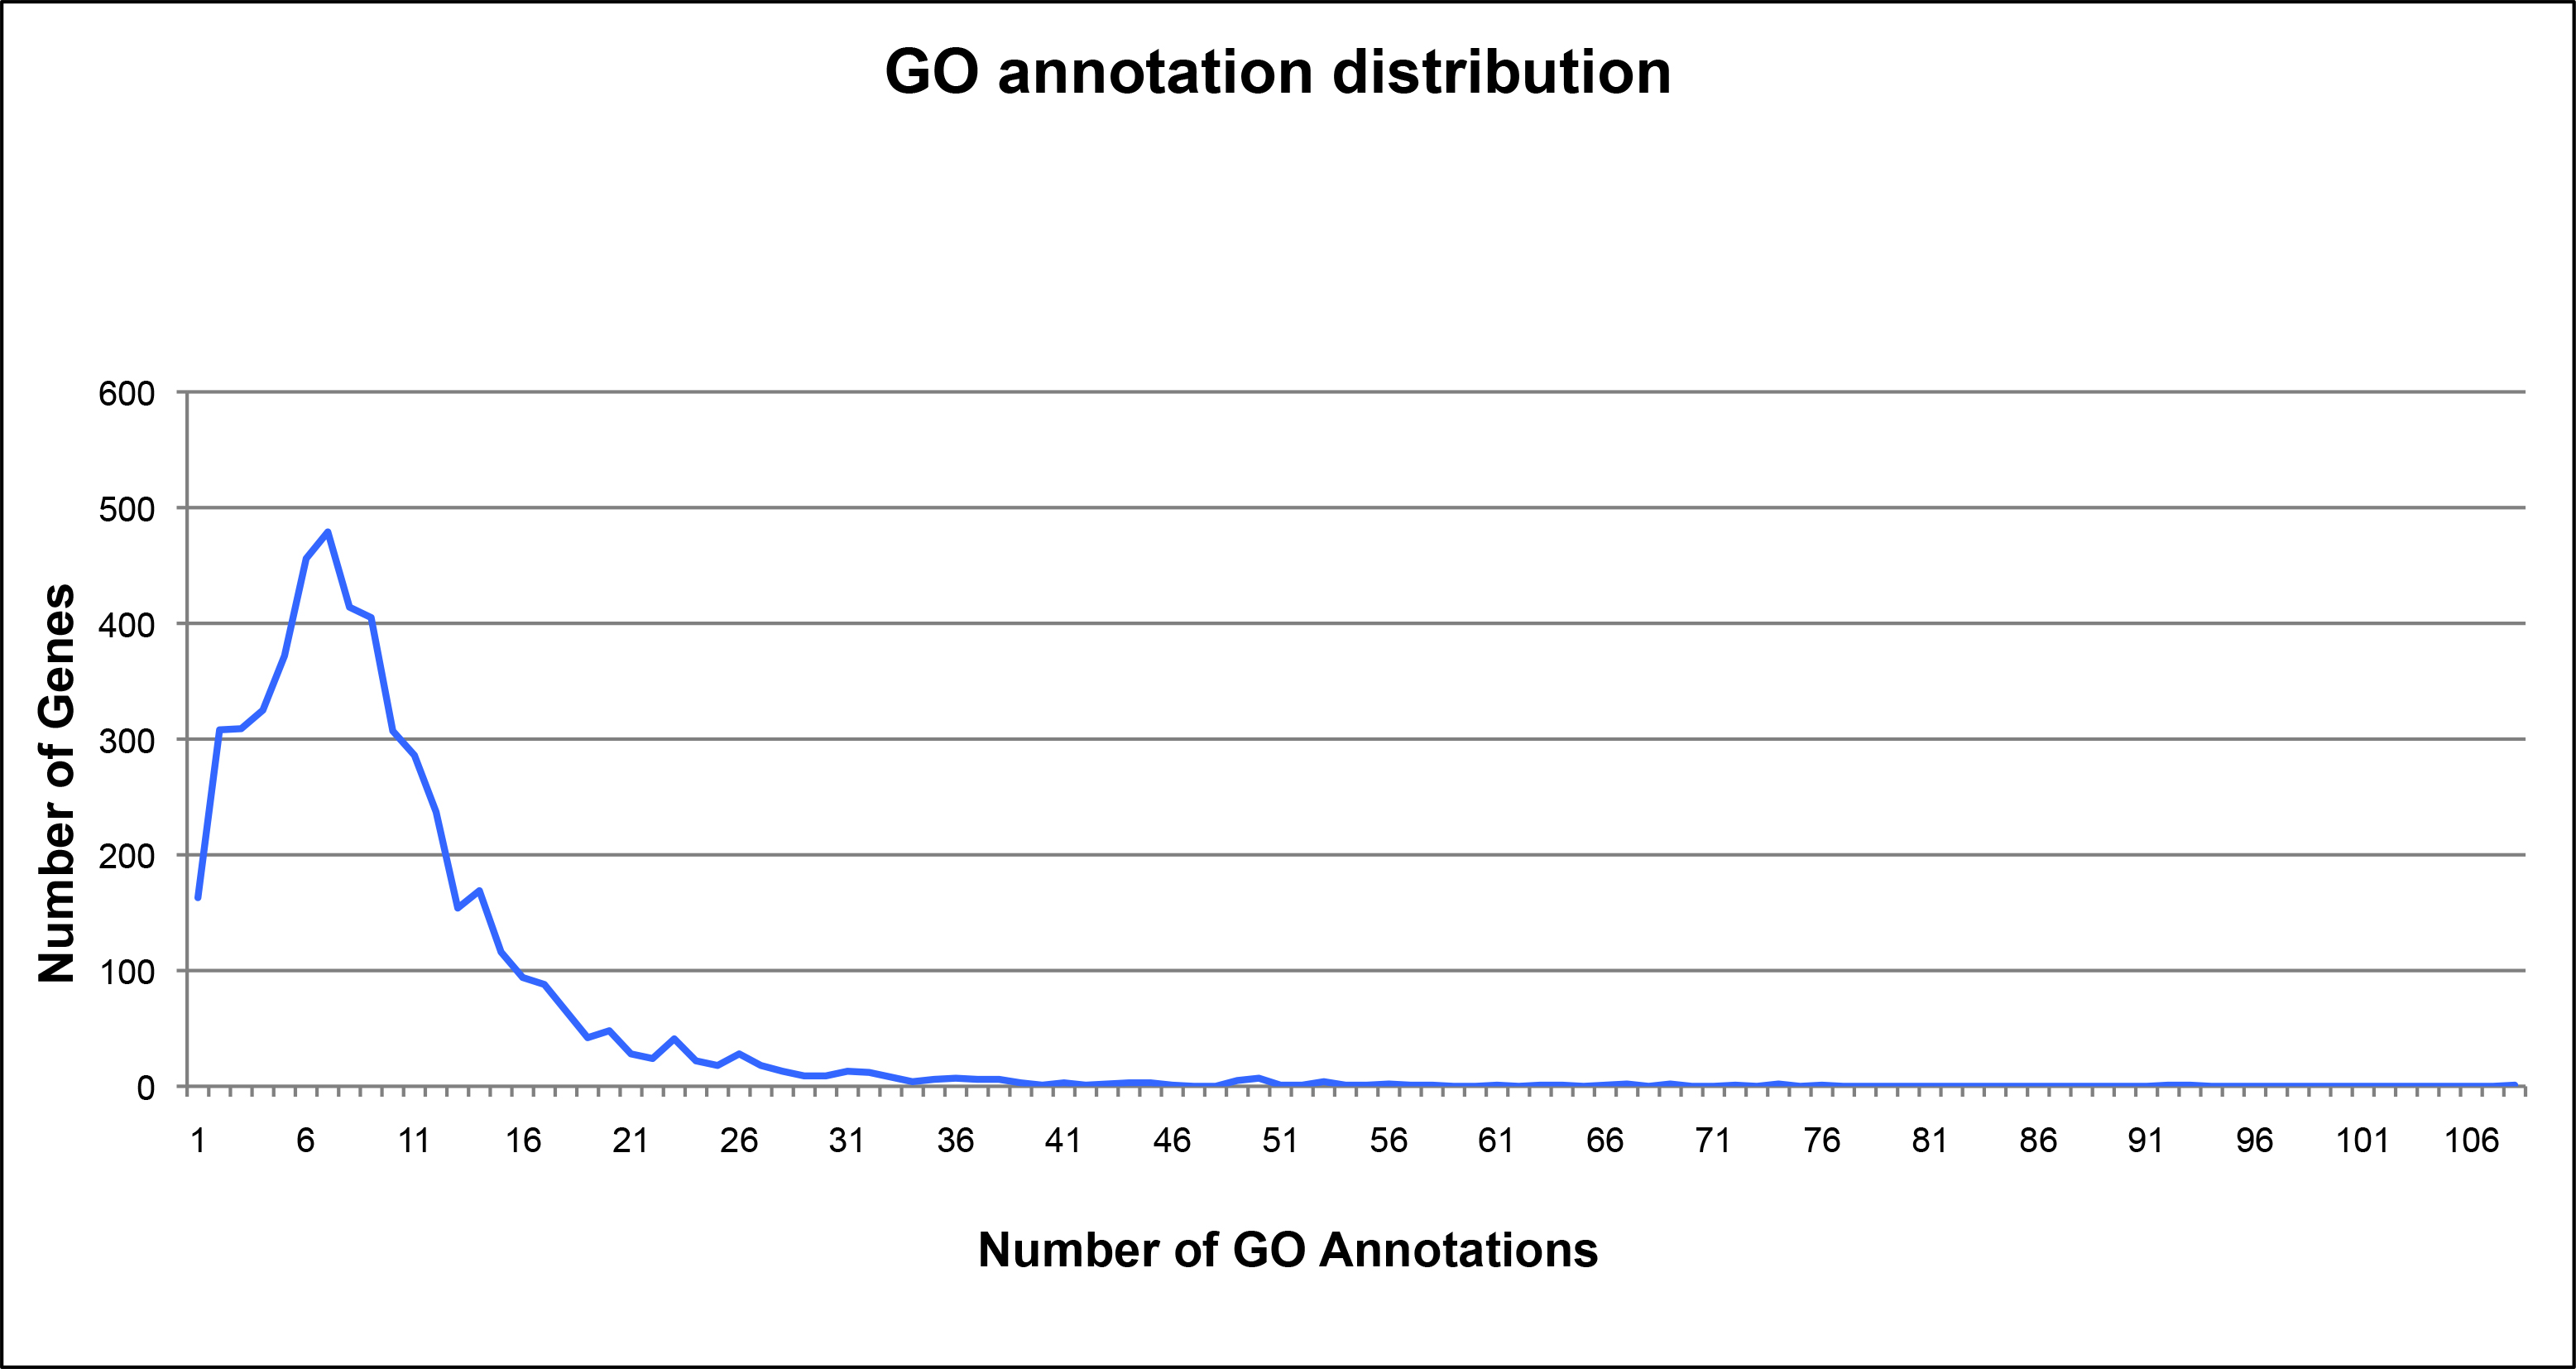
 Figure 5 of
Ziesel, Mol Vis 2014; 20:947-955.
Figure 5 of
Ziesel, Mol Vis 2014; 20:947-955.