Figure 3. A non-proportional Venn diagram describing overlap of genes identified by each of the three experiments. “Research Genetics”
indicates the Research Genetics macroarrays, “GDA” indicates the GDA macroarrays, and “Soares” indicates library 10,282 produced
by the laboratory of Bento Soares.
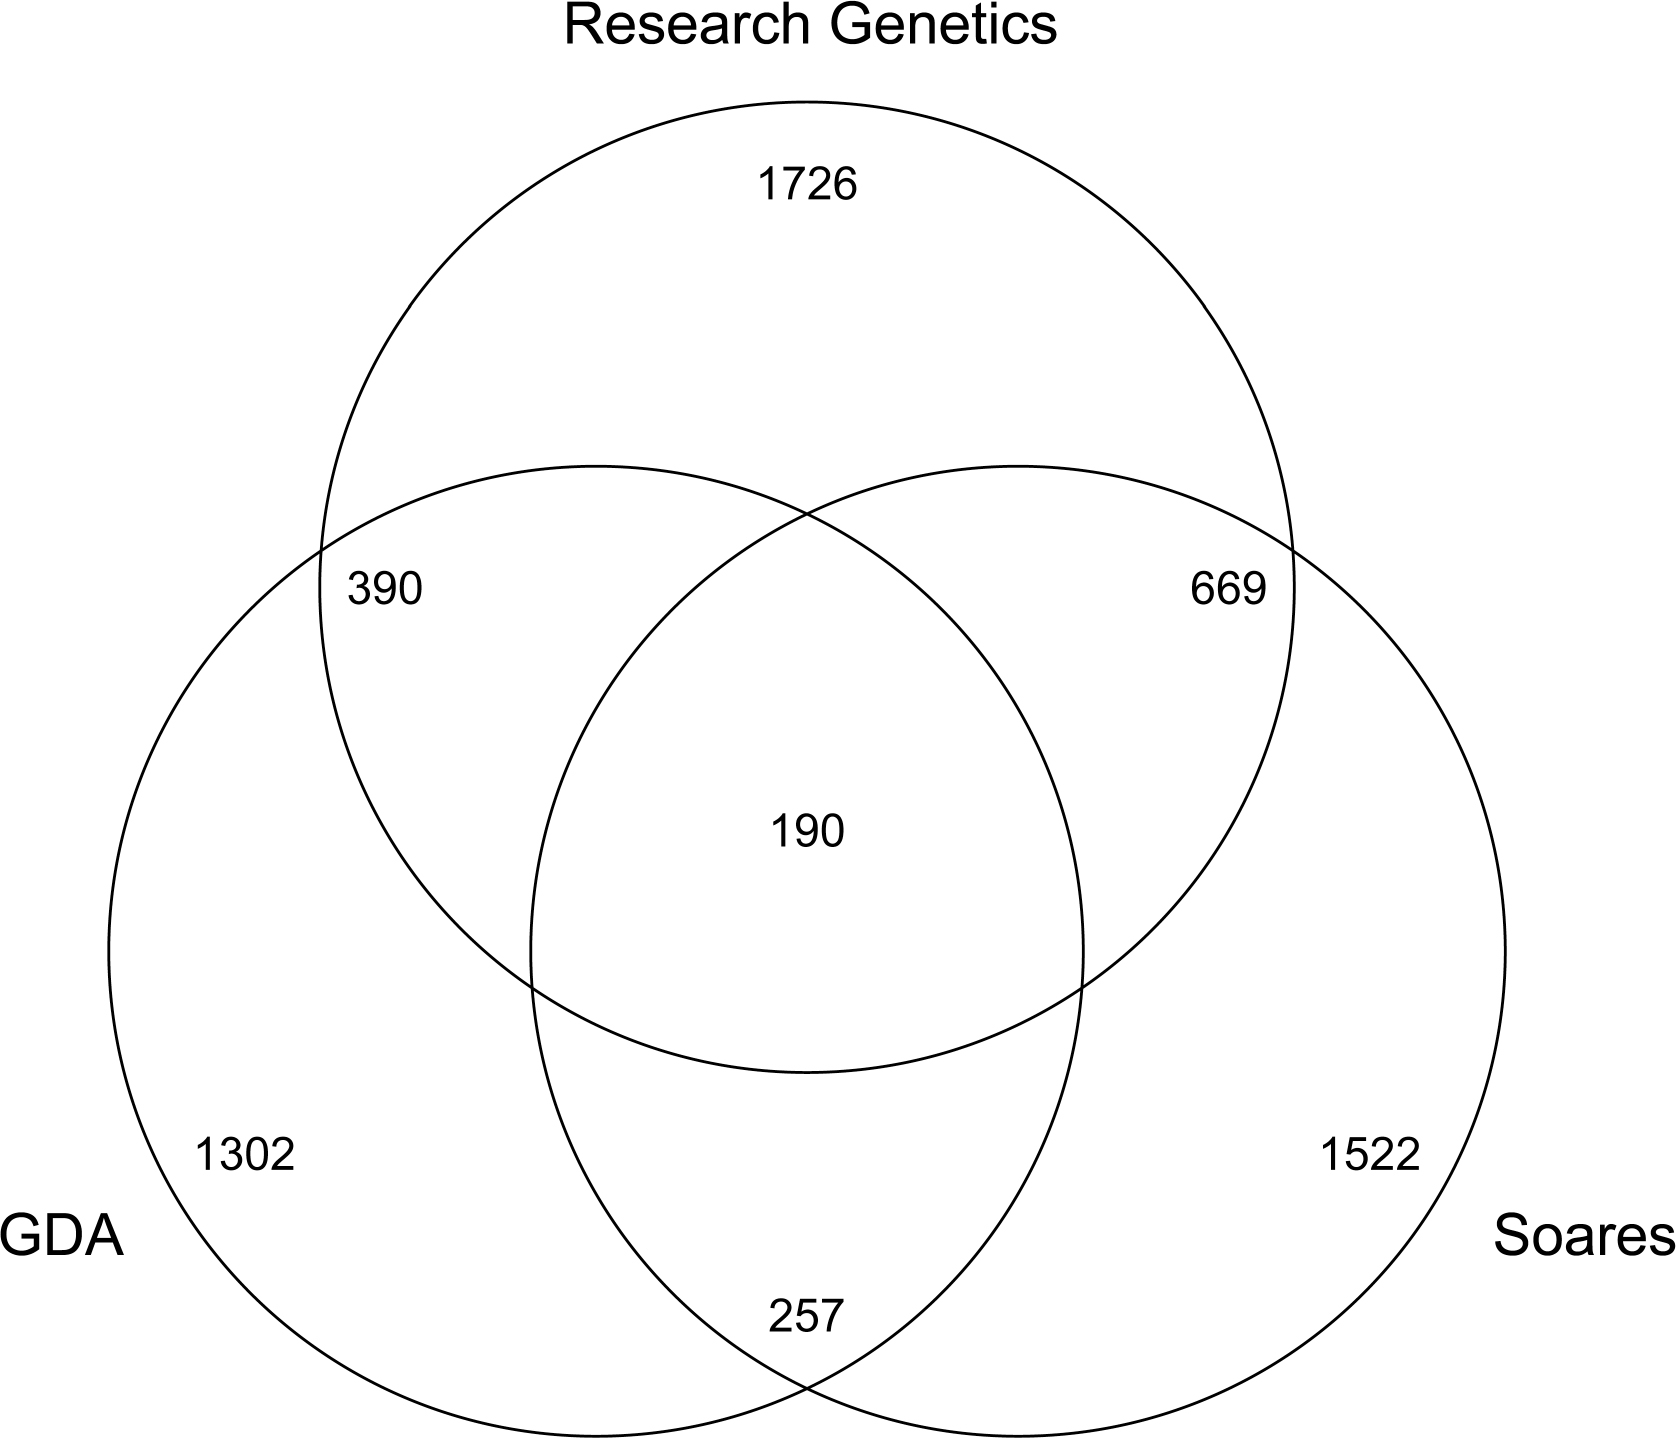
 Figure 3 of
Ziesel, Mol Vis 2014; 20:947-955.
Figure 3 of
Ziesel, Mol Vis 2014; 20:947-955.