Figure 8. Results of the examinations for patients 3Ia and 3IIa in family 3. A: Multifocal electroretinography (mERG) showed reduced central and paracentral amplitudes. The implicit times for the latest
mERG were normal in the right eye but slightly prolonged in the left eye. B: The optical coherence tomography (OCT) macular thickness map showed attenuation in all segments except the outer superior
and inferior ones. C: Fundoscopic changes include yellow flecks, atrophies, and irregular pigmentation around the maculas. D: In addition, the contour of the macula appeared attenuated. E: Goldmann visual field plots from patient 3IIa showed large central scotomas for the V4e object, including the most central
20–25°. Moreover, the V4e isopters were normal but the I4e isopters seemed slightly constricted. F–G: Retinal thickness measured with OCT is attenuated in all segments of the macular map. H: Fundoscopy showed slightly irregular pigmentation in the maculas.
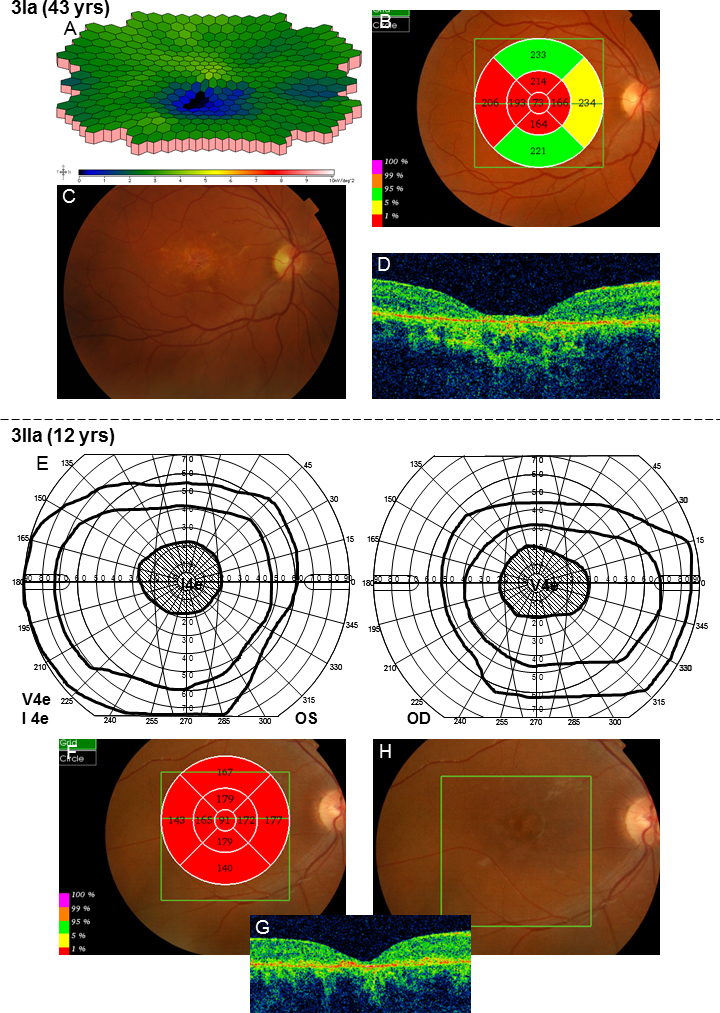
 Figure 8 of
Kjellström, Mol Vis 2014; 20:89-104.
Figure 8 of
Kjellström, Mol Vis 2014; 20:89-104.