Figure 7. Goldmann visual field plots for patient 3Ia showing normal outer borders for the V4e and I4e isopters, along with small central
scotomas. The scotomas have grown deeper (from I2c to V4e) and slightly wider over the years (from 1992 to 2012). Notice that
the II4e object and not the I4e was used in 1992.
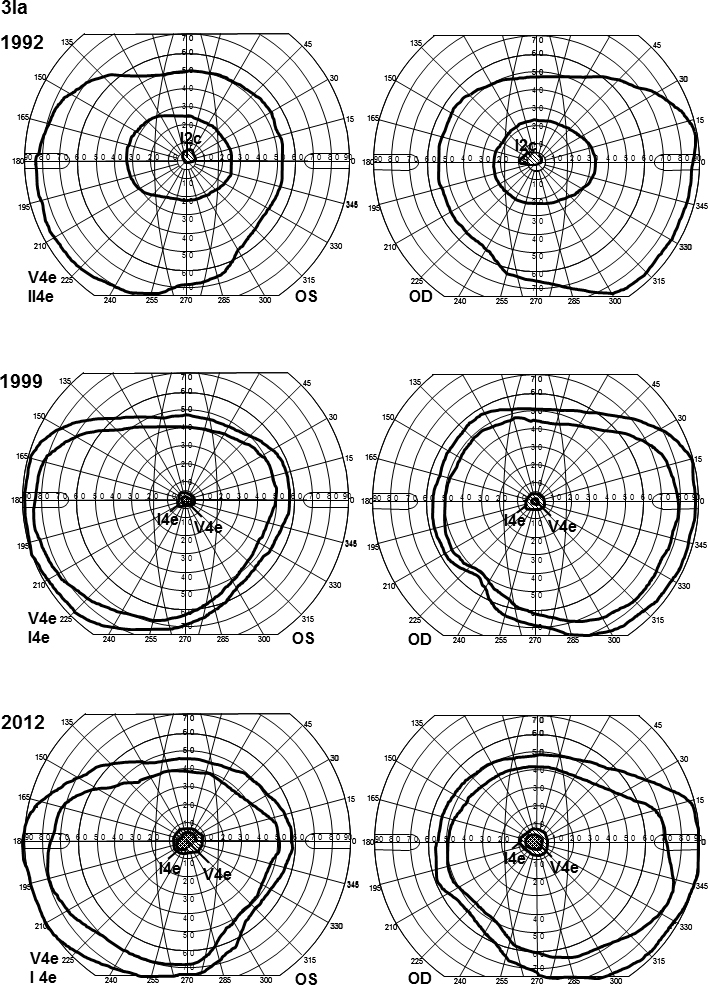
 Figure 7 of
Kjellström, Mol Vis 2014; 20:89-104.
Figure 7 of
Kjellström, Mol Vis 2014; 20:89-104.