Figure 5. Results of the examinations for patients 2IIa and 2IIb in family 2. A: Fundoscopic changes including slightly pale optic nerve heads, attenuated vessels, a few pigmentations and atrophies in
the maculas and bone spicule-like pigmentations in the midperiphery were found. B–C: Optical coherence tomography (OCT) measurement of retinal thickness showed attenuation in all segments of the retinal map.
D: Goldmann visual field plots for patient 2IIb showed normal outer borders for the V4e and I4e but small scotomas for the
04e object. E: Around the maculas, discrete yellow flecks and irregular pigmentation was found. F–G: OCT showed attenuation of retinal thickness in all segments of the macular map (H) multifocal electroretinography (mERG) showed reduced amplitudes within the central 15° compared to the normal condition
(I). The implicit times of the mERG were normal though.
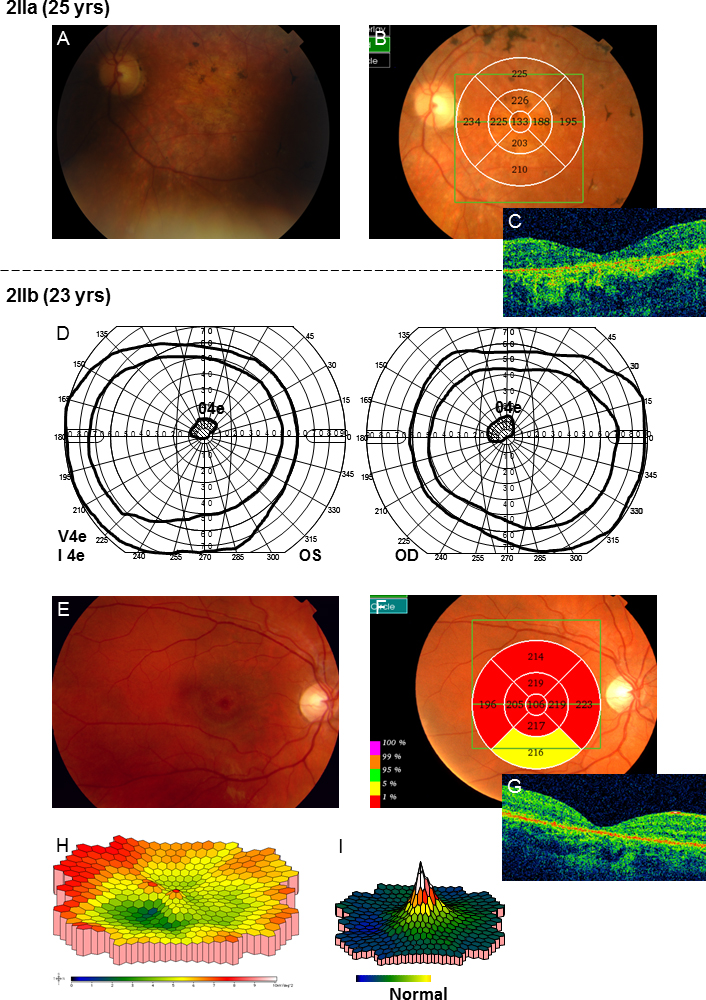
 Figure 5 of
Kjellström, Mol Vis 2014; 20:89-104.
Figure 5 of
Kjellström, Mol Vis 2014; 20:89-104.