Figure 6. Images of the retina of the control, β2-adrenergic receptor knockout mice+Compound 49b, and β2-adrenergic receptor knockout
mice. A–C: Compound 49b increased retinal thickness compared to untreated β2-adrenergic receptor knockout mice. A: Control. B: β2-adrenergic receptor knockout (KO) mice+49b. C: β2KO mice only. D: Graph of the mean ± standard error of the mean (SEM) of the retinal thickness of five mice in each group. Scale bar = 50
μm. The black arrow demarcates the thickness area measured. *p<0.05 versus wild-type (WT); #p<0.05 versus β2-adrenergic receptor
KO mice. n = 5 for all groups. Data are mean ± SEM.
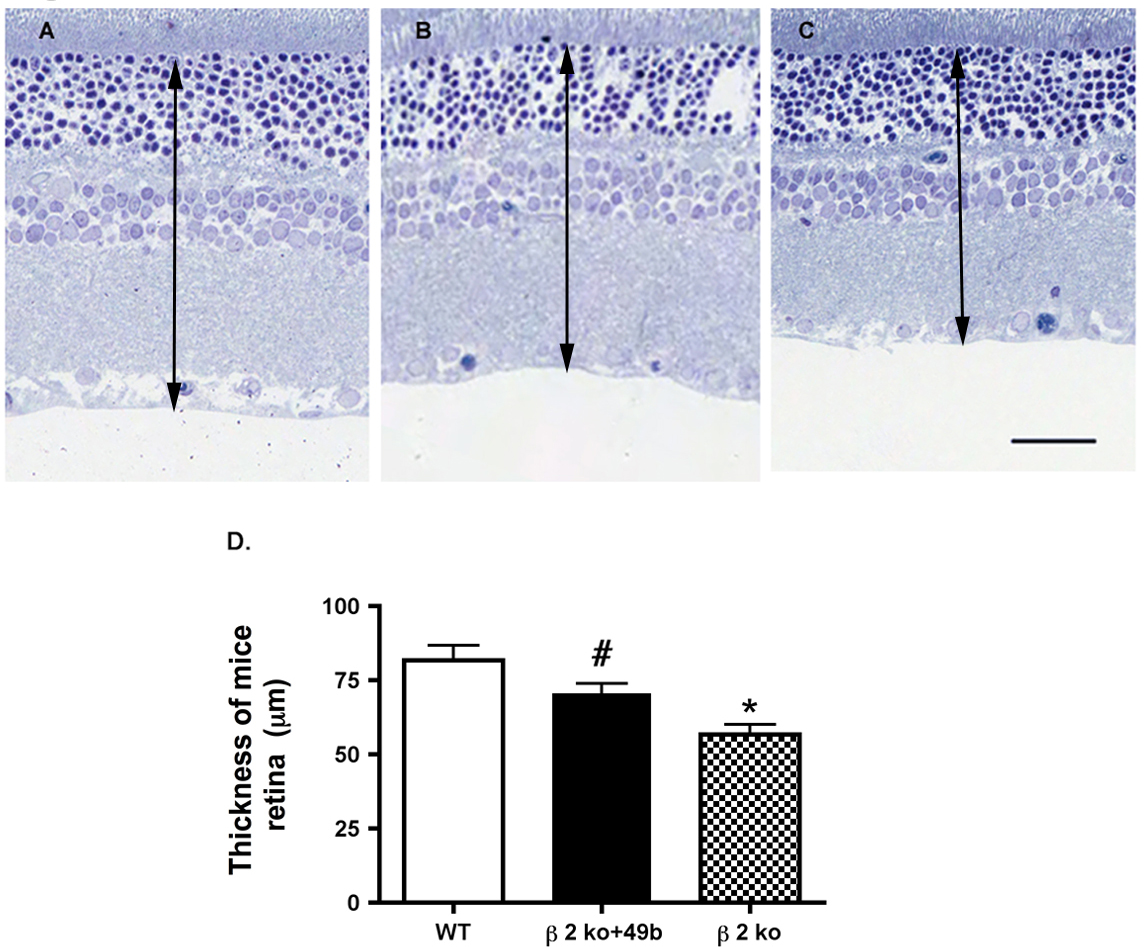
 Figure 6 of
Jiang, Mol Vis 2014; 20:872-880.
Figure 6 of
Jiang, Mol Vis 2014; 20:872-880.