Figure 4. Fluorescence microscopy in normal and laser-treated rat RPE-choroid, triple labeled red for fibronectin (FN, row 2) and vitronectin
(VN; row 4), green for isolectin, and blue for nuclear staining. The red arrows indicate normal blood vessels. The orange
arrows indicate the antibody binding for FN and VN between the subretinal space and sclera after laser treatment. The yellow
and blue arrows indicate the moderate decrease in FN and disappearance in VN, respectively; the green arrows show FN localization
around forming tubules. Scale bar = 100 μm.
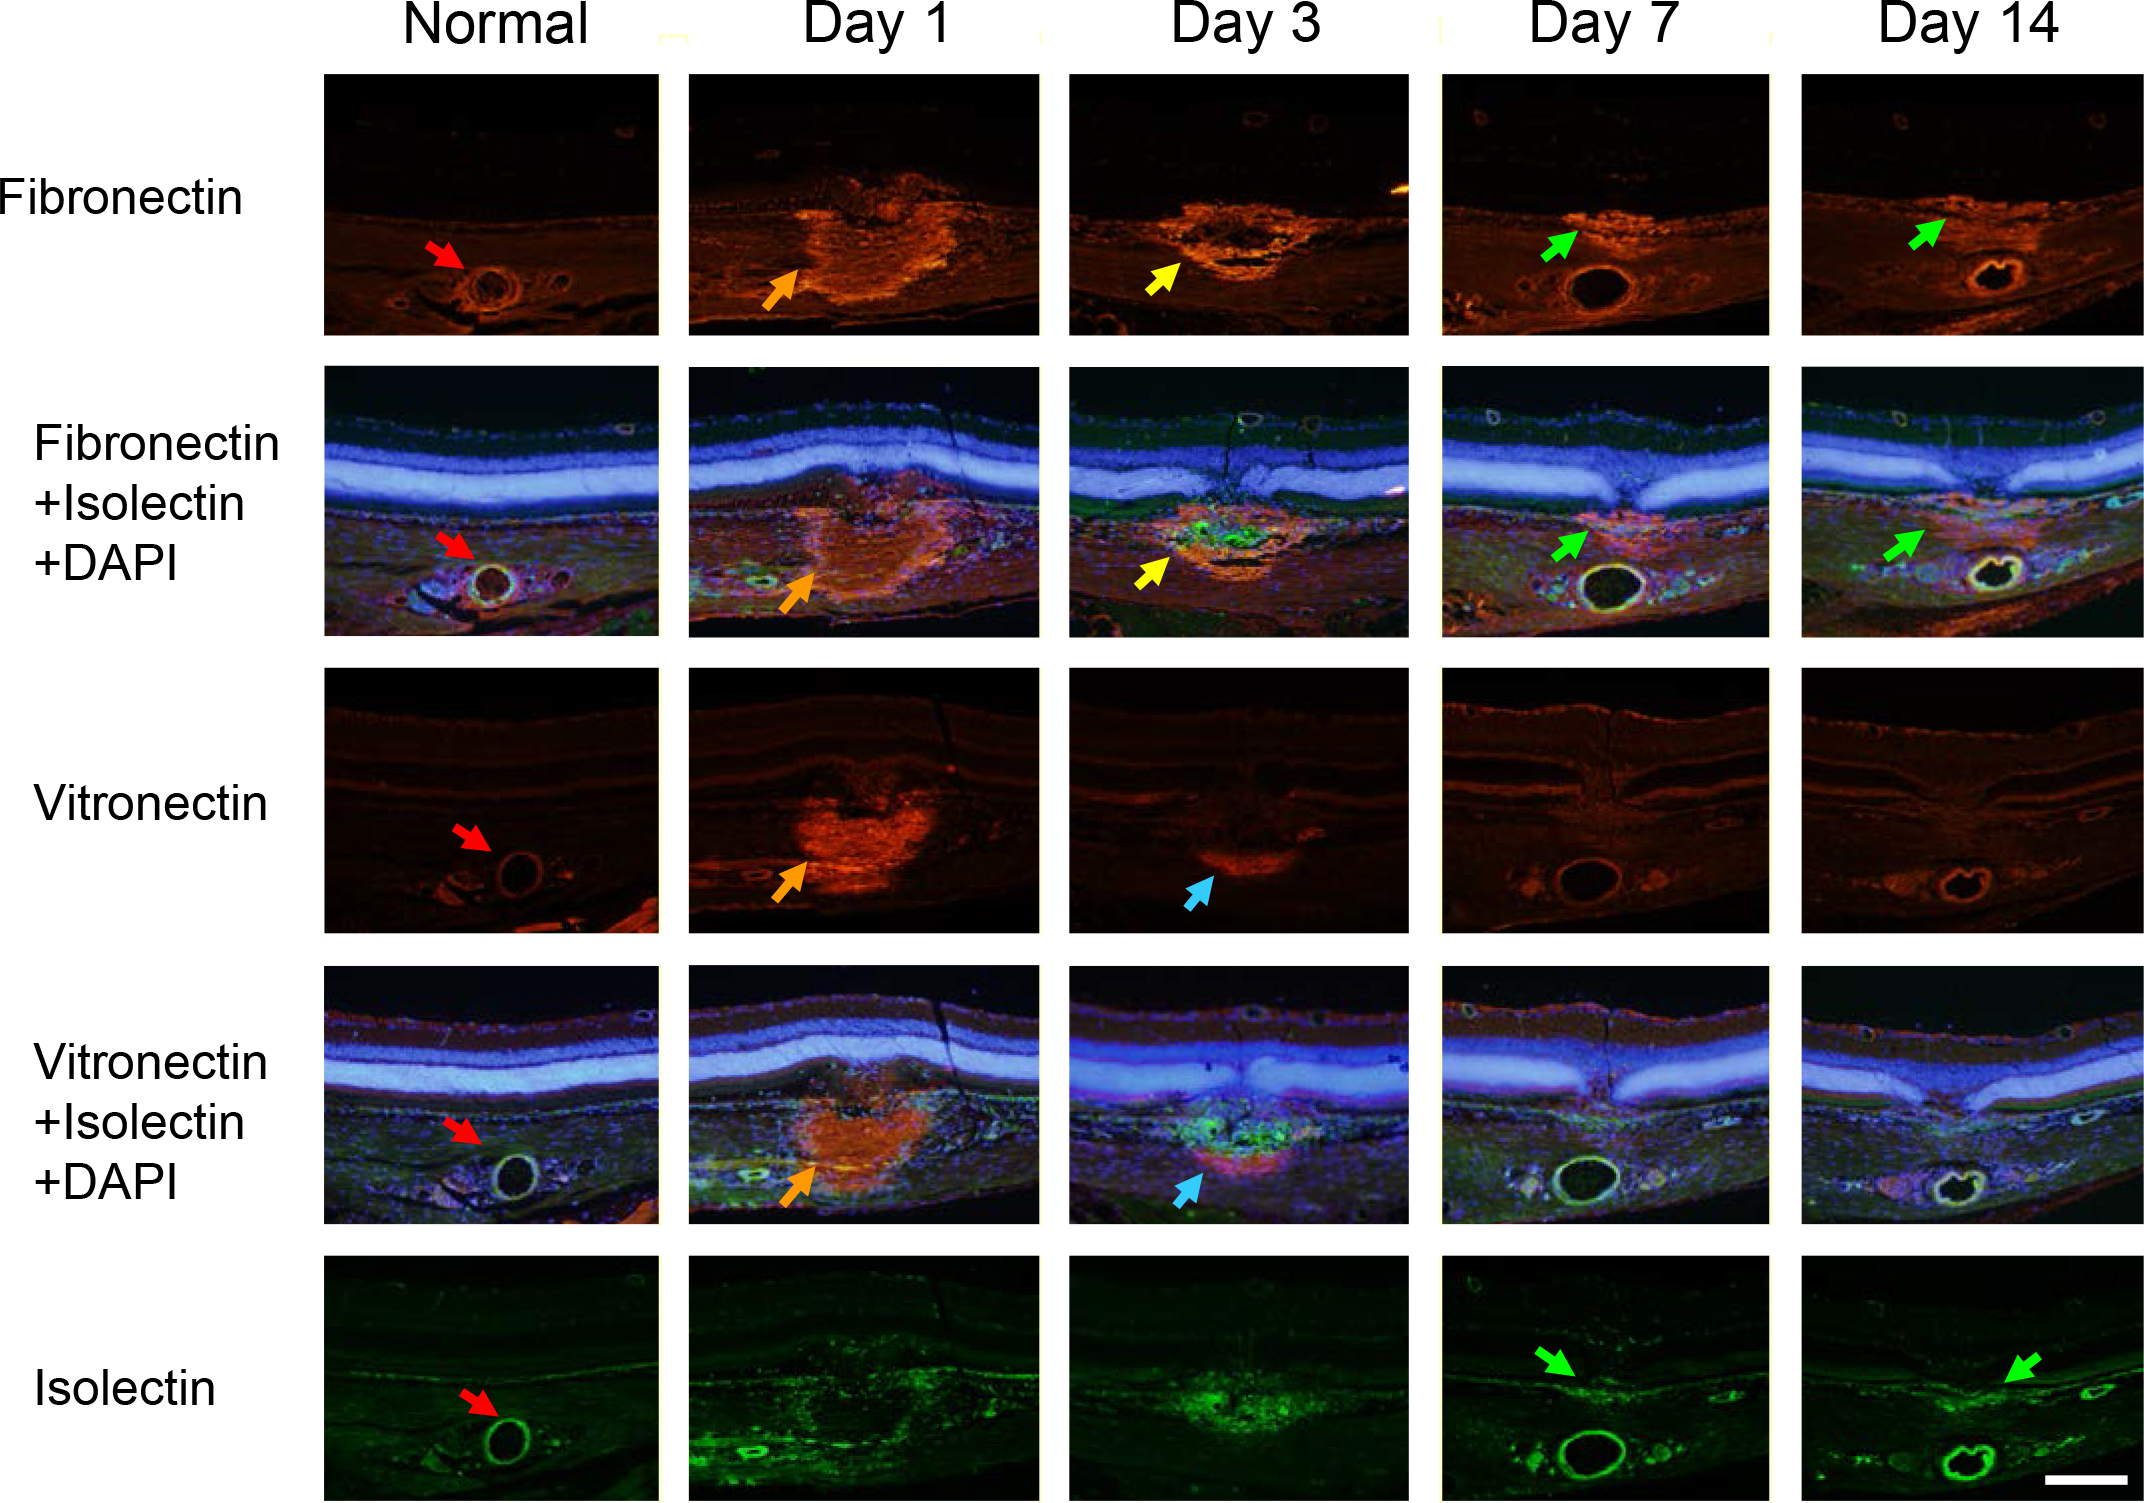
 Figure 4 of
Nakajima, Mol Vis 2014; 20:864-871.
Figure 4 of
Nakajima, Mol Vis 2014; 20:864-871.