Figure 3. Fluorescence microscopy with red fluorescent antibody for integrin αv in rat RPE-choroid. Non-treated retinas show positive
antibody binding for integrin αv around the normal vessels (red arrows) and in the RPE (orange arrows). The yellow arrows
show positive red antibody binding for integrin αv between the subretinal and suprachoroidal spaces after laser treatment.
The white arrow indicates isolectin binding in green macrophages and microglial and endothelial cells and near the new tubular
structures (green arrows). The blue arrows show colocalization of red integrin αv with green macrophages and microglial and
endothelial cells. Scale bar = 100 μm.
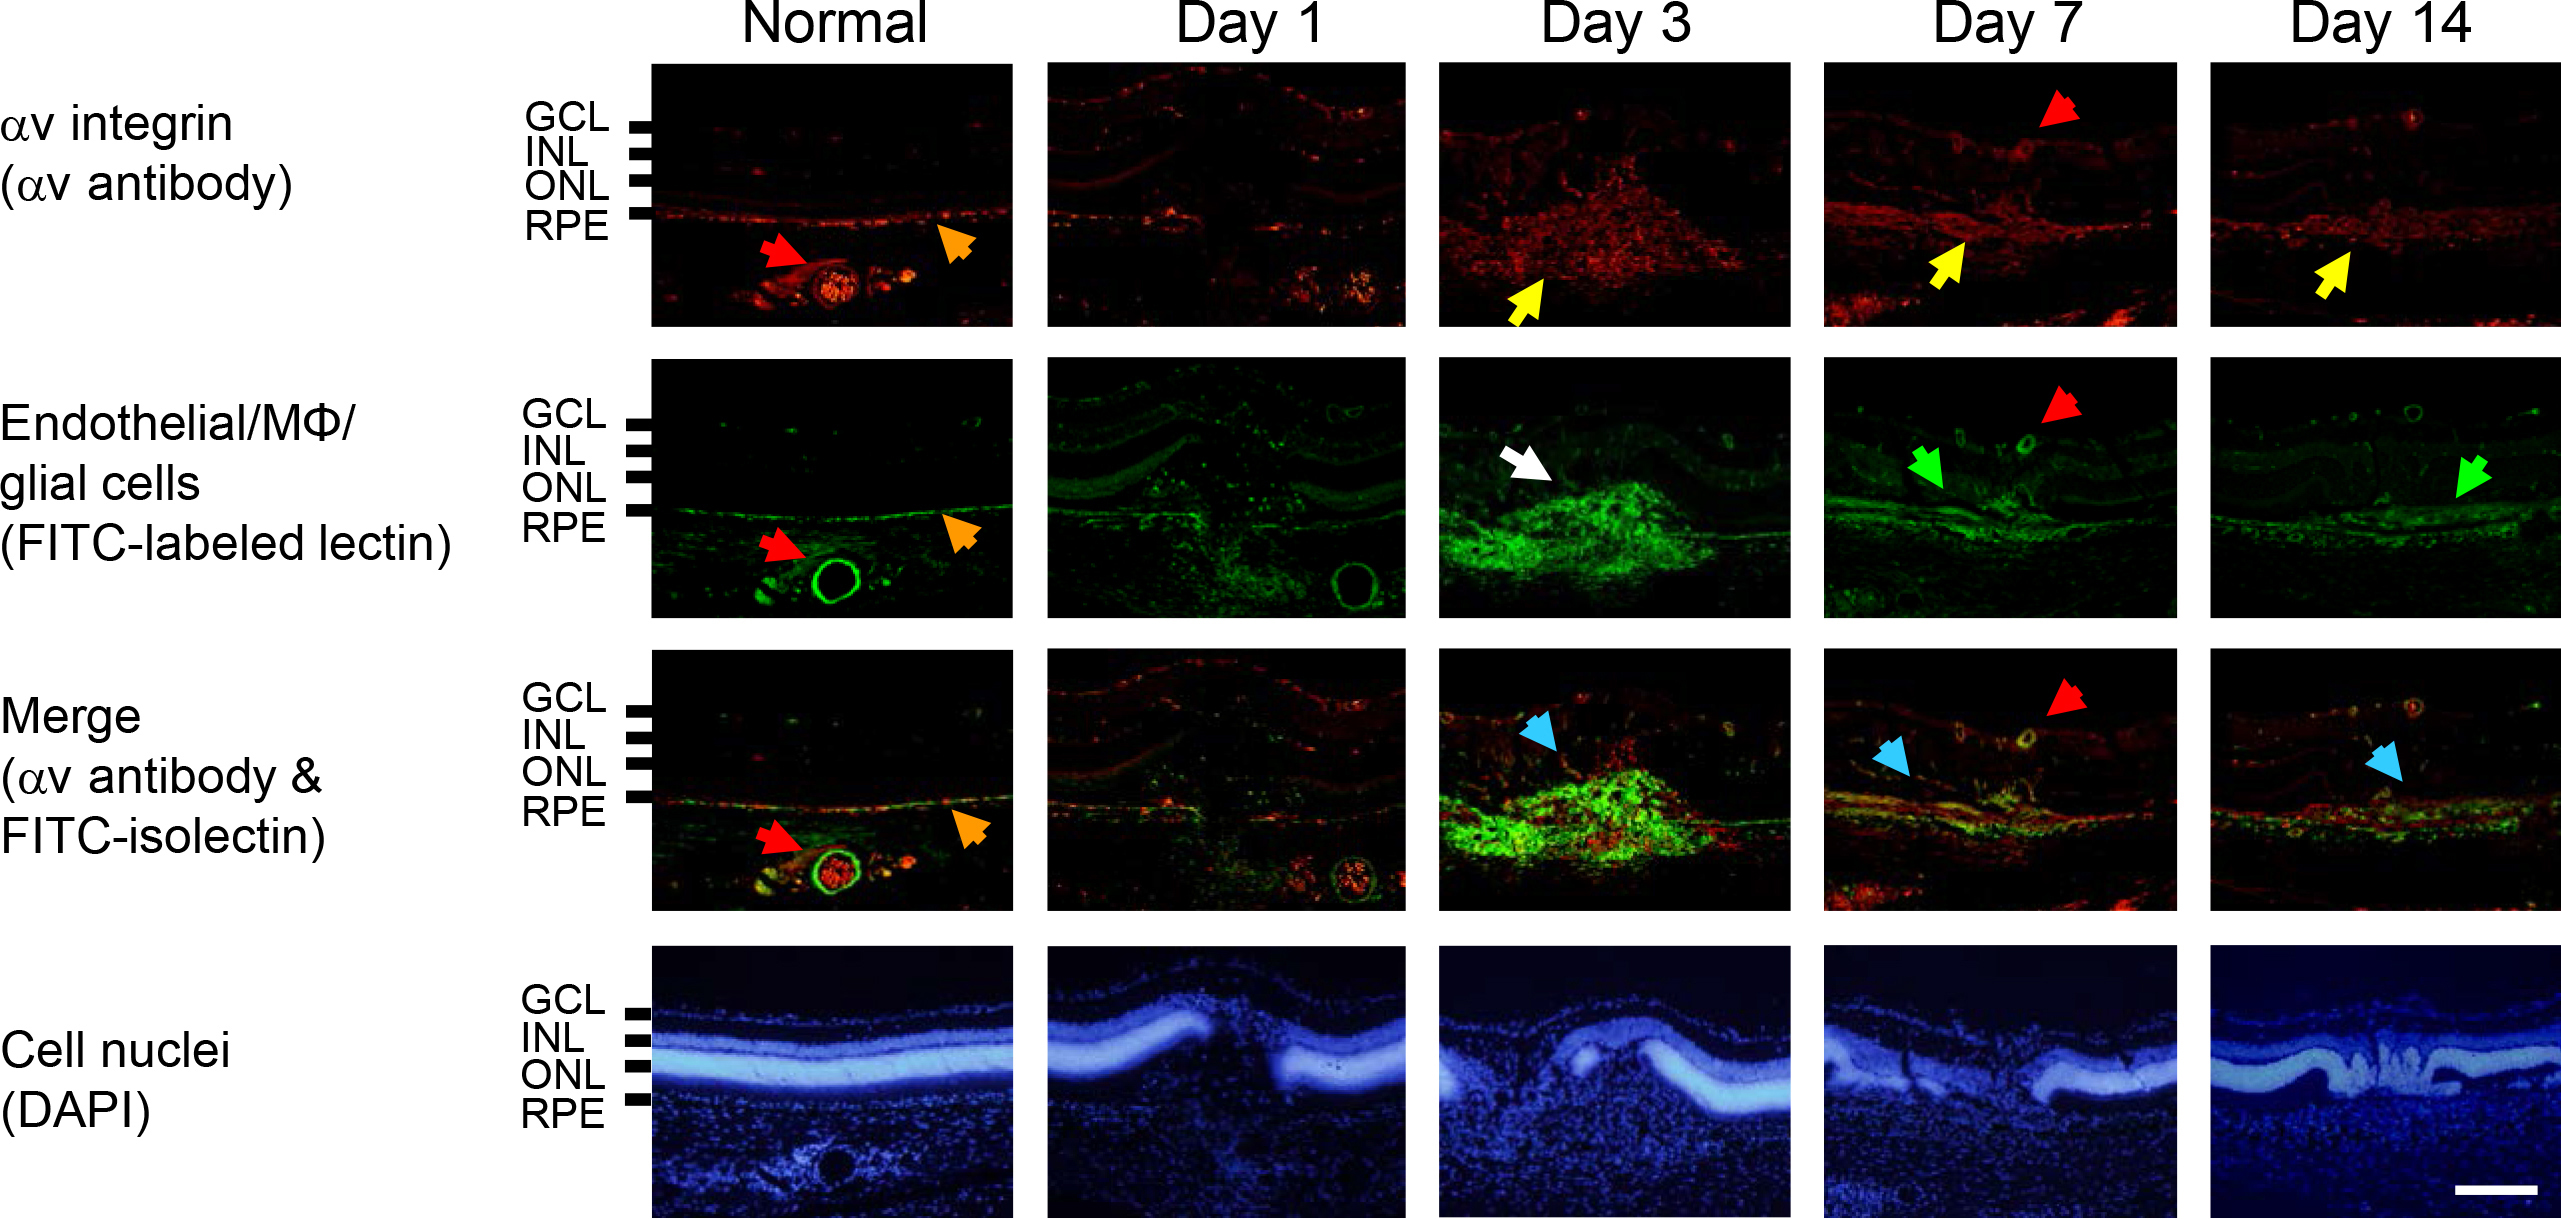
 Figure 3 of
Nakajima, Mol Vis 2014; 20:864-871.
Figure 3 of
Nakajima, Mol Vis 2014; 20:864-871.