Figure 1. Representative flatmount images of macrophages and microglial and endothelial cells labeled with green fluorescent antibody
for isolectin in normal and laser-treated rat RPE-choroid preparations. The red arrow indicates macrophages and microglial
and endothelial cells; the yellow arrows indicate new tubular structures. Scale bar = 200 μm.
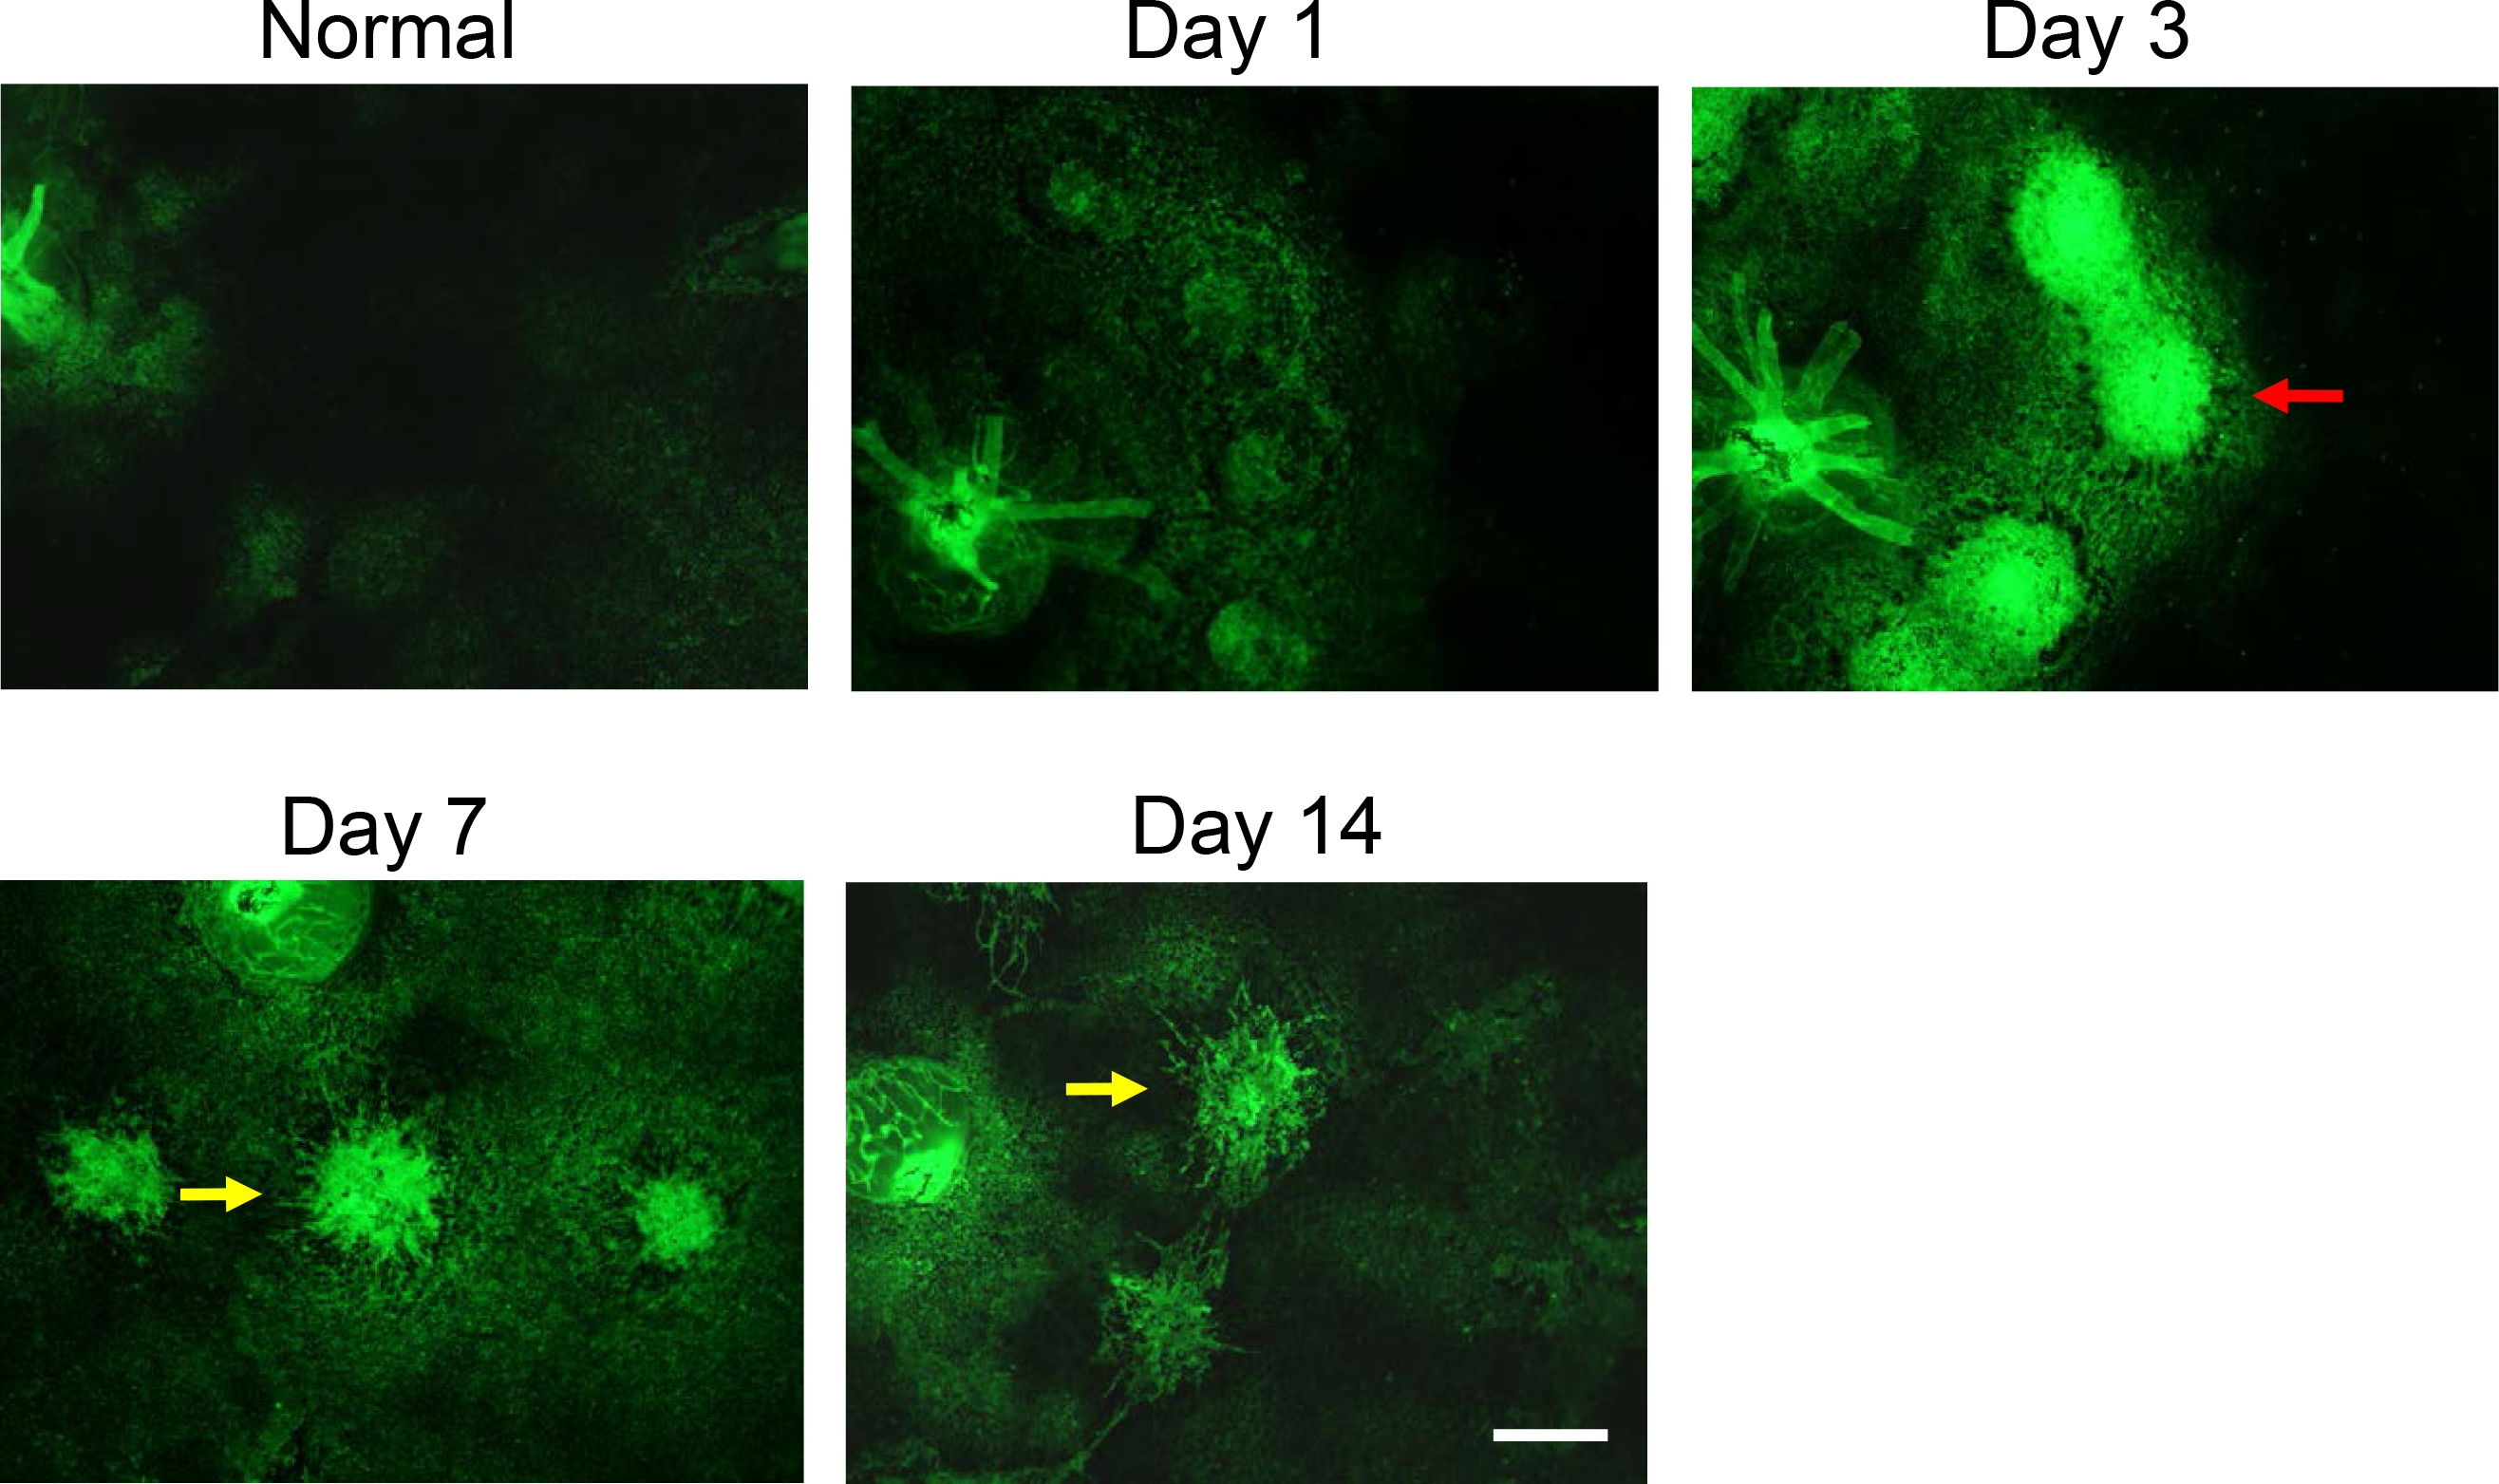
 Figure 1 of
Nakajima, Mol Vis 2014; 20:864-871.
Figure 1 of
Nakajima, Mol Vis 2014; 20:864-871.