Figure 3. Effect of tocotrienol (0.03%) in microemulsion (TTE) and liposomal (TTL) formulation of on the opacity index of galactose
fed rats during 4 weeks period of treatment. VE - vehicle for microemulsion, VL - vehicle for liposomes. All values are mean
± standard deviation (SD; n = 6). ap<0.05 versus normal; bp<0.05 versus VE; cp<0.05 versus VL.
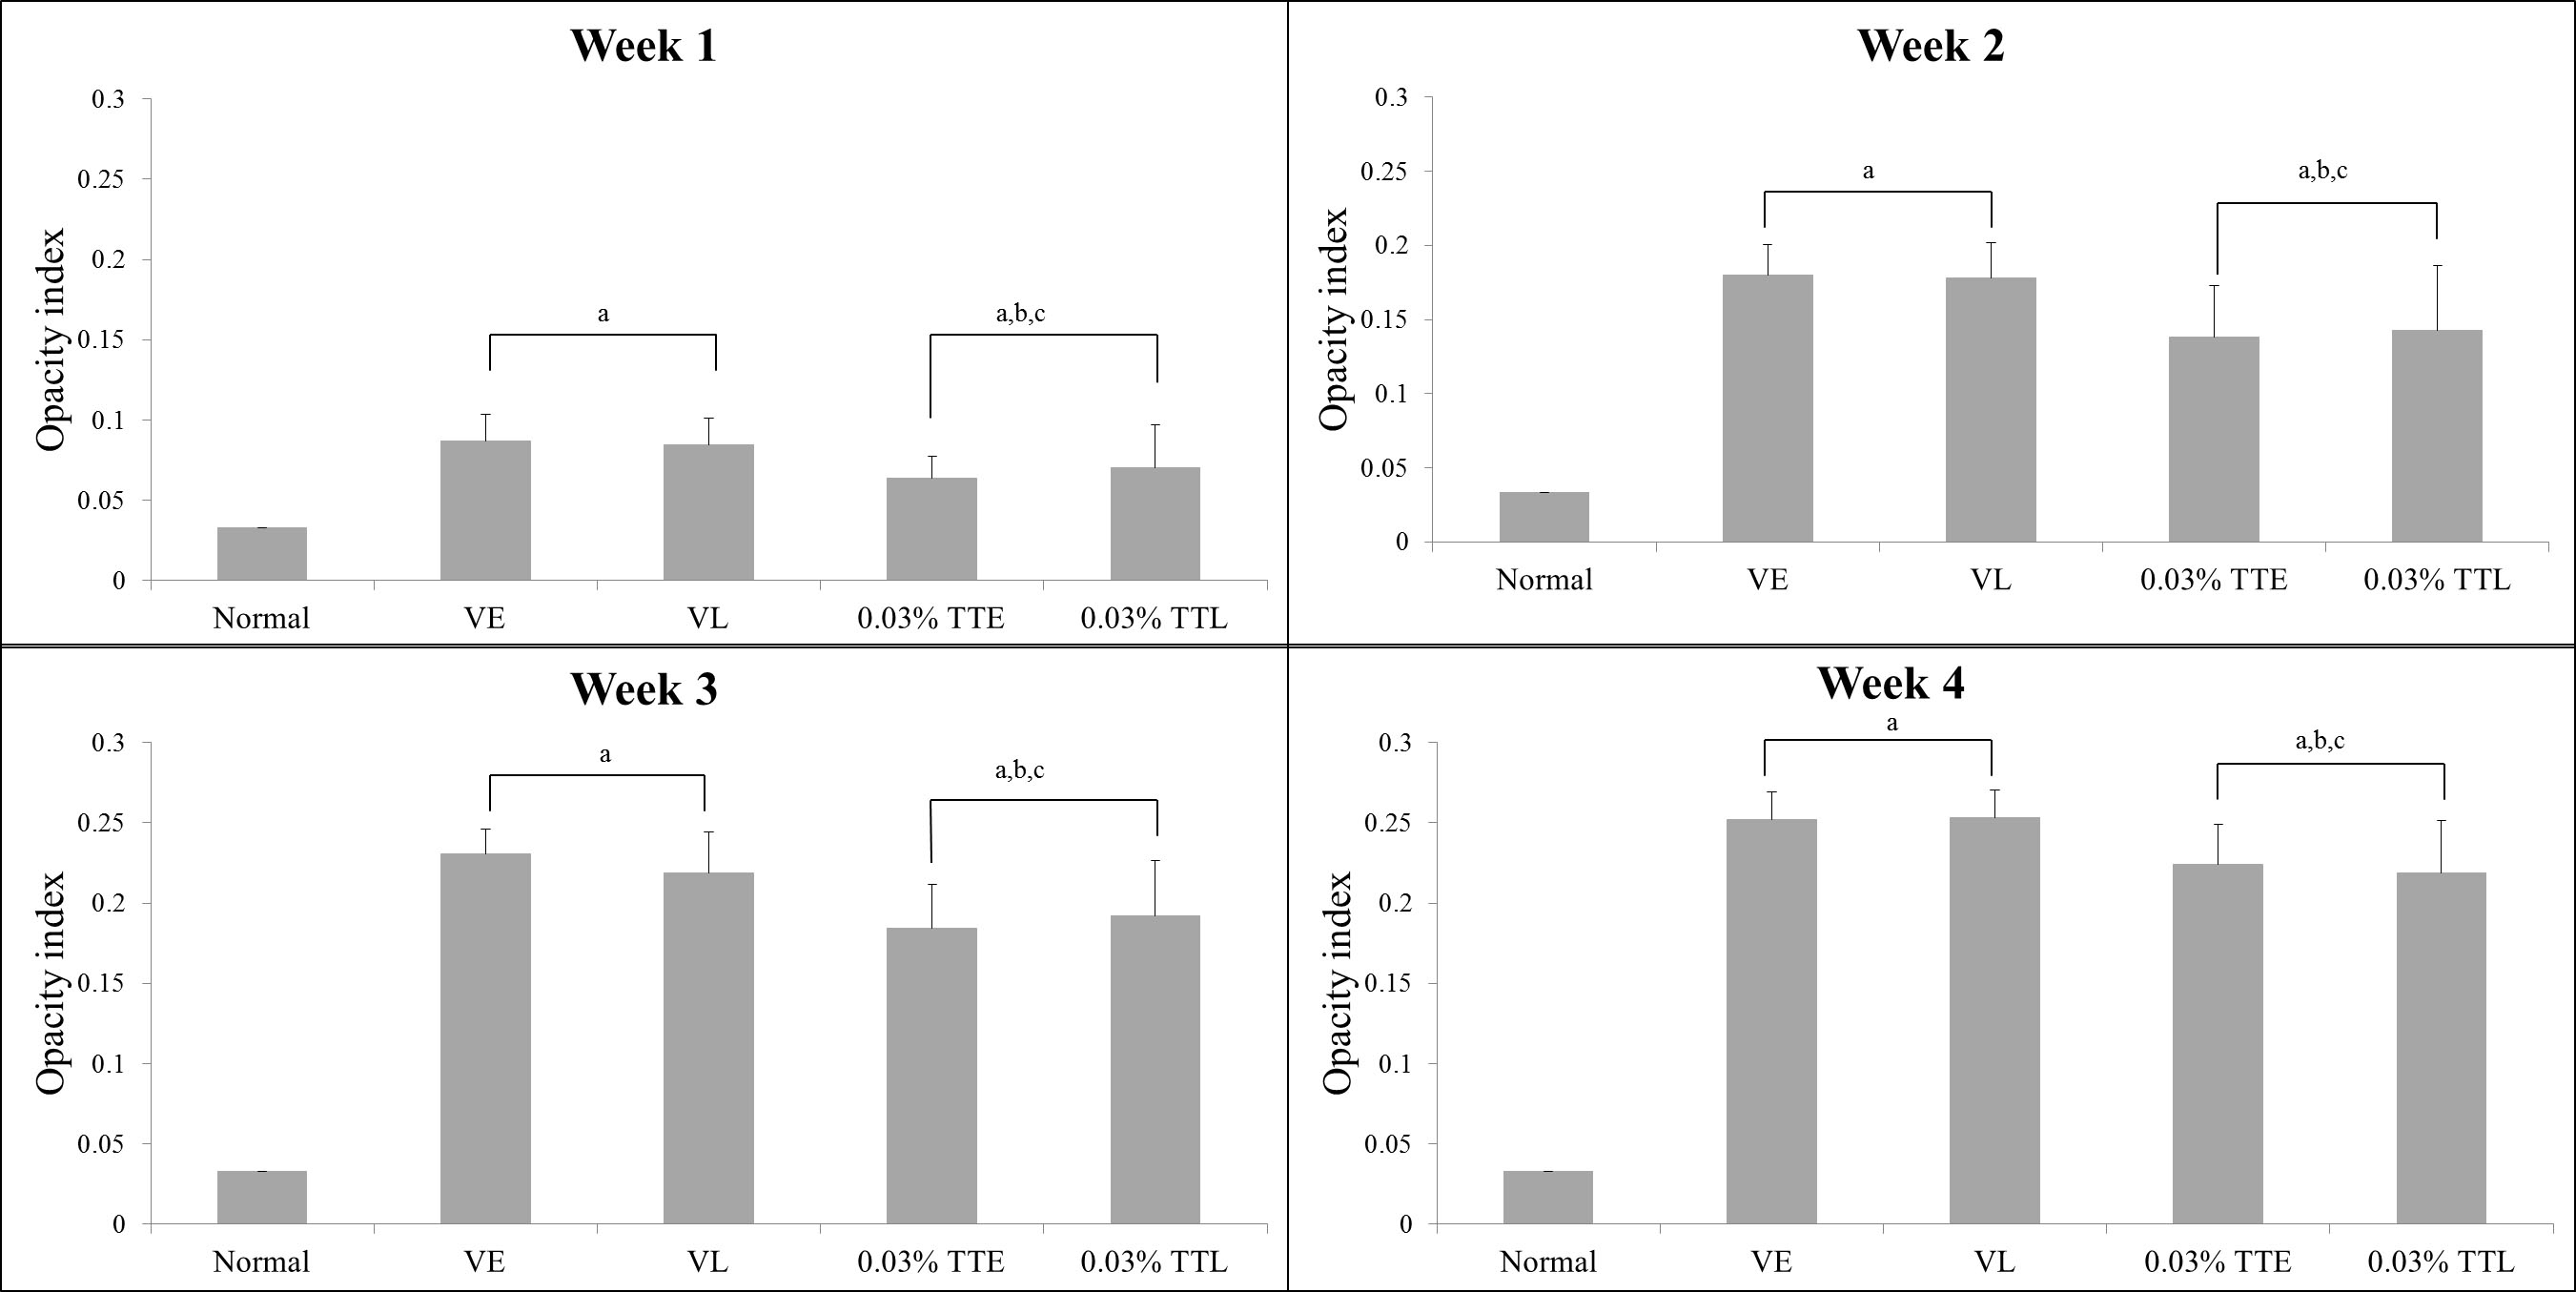
 Figure 3 of
Nasir, Mol Vis 2014; 20:822-835.
Figure 3 of
Nasir, Mol Vis 2014; 20:822-835.